
![]() This blog post accompanies the SDPR Morning Macro segment that airs Monday, April 13.
This blog post accompanies the SDPR Morning Macro segment that airs Monday, April 13.
In recent weeks, macroeconomic sentiments have shifted dramatically: the U.S. economy has likely exited the longest peacetime expansion phase of the business cycle; a macroeconomic recession looms large. Nevertheless, an impartial, empirical, and persuasive demonstration of this claim of trouble ahead would be helpful, I reason.
Enter Claudia Sahm.
In the most recent Morning Macro blog post (“States’ Plights“), I referred to the Sahm-rule recession indicator, an increasingly popular macroeconomic indicator named for Claudia Sahm, the director of macroeconomic policy at the Washington Center for Equitable Growth and formerly with the Board of Governors of the Federal Reserve. According to Sahm, the rule signals a macroeconomic recession when the three-month moving-average unemployment rises by at least a half of a percentage point above the lowest three-month moving-average unemployment rate in the previous 12 months. In Figure 1, I illustrate the Sahm-rule recession indicator, complete with a horizontal line indicating the half of a percentage point threshold and gray recession bars based on business-cycle peak and trough dates supplied by the Business-Cycle Dating Committee of the National Bureau of Economic Research (NBER).

According to Figure 1, each time the Sahm-rule indicator exceeded the half of a percentage point threshold, a business-cycle recession (indicated by a gray bar) soon followed. Moreover, throughout the Post-WWII era pictured in Figure 1, the Sahm rule essentially never produced a false positive: this is to say, the rule never registered a value above 0.5 without a recession following immediately or very soon thereafter. In Figure 1, the most recent data point corresponds to a Sahm-rule measure of 0.30 for March, 2020, the latest month for which the unemployment rate, of which the Sahm rule is a function, is available from the Bureau of Labor Statistics (BLS). The measure jumped suddenly from 0.0 registered in February, 2020, because the unemployment rate rose from the historically low rate of 3.5 percent in February to 4.4 percent in March. In Figure 2, I illustrate the U.S. unemployment rate. (For more on the unemployment rate, including how the BLS determines whether an individual is unemployed, see the Morning Macro segment, “Separation Anxiety.”)

The unemployment rate illustrated in Figure 2 is the so-called U3 version—the standard, relatively narrow measure of the unemployment rate often cited in media coverage of the labor market. In order to calculate this measure, the BLS divides the number of unemployed individuals by the number of individuals in the labor force—the number of unemployed individuals plus the number of employed individuals. The extent to which the labor market deteriorated from February to March, when the unemployment rate jumped by 0.9 percentage points, is readily apparent in Figure 2; incidentally, this jump in Figure 2 precisely corresponds—according to the Sahm-rule algorithm—to the March-2020 jump in Figure 1. As SCHOOLED readers know well, the unemployment rate is an inherently macroeconomic statistic; it describes a general feature of the economy-wide labor market as opposed to a specific feature of the labor market for, say, automobile mechanics in Kentucky or dentists in South Dakota.
In the wake of a severe exogenous macroeconomic shock, such as the intentional shutdown of a significant share of the U.S. economy in response to the novel coronavirus, this particular general feature of the macroeconomy—the deterioration of its labor market—will reflect itself very soon, if not immediately, in nearly all industry- and state-specific labor markets throughout the U.S. This is a problem. Unemployment provokes deeply personal struggles; widespread unemployment is particularly pernicious. The psychological and sociological challenges that attend a significant rise in unemployment are persistent. This is, in part, because, as Figure 2 makes abundantly clear, unemployment rates generally rise in much less time than unemployment rates take to recover from the shock that precipitated the rise; put differently, sharp spikes in the unemployment rate are followed by gradual—read, painfully slow—declines. Thus, the easiest way to save a job is not to destroy it in the first place. Not surprisingly, this pattern of persistence is abundantly evident at the state level as well. Consider, for example, the unemployment rate for the state of South Dakota (home to Morning Macro) around the Great Recession, when the unemployment rate jumped 2.5 percentage points in twenty months (from 2.6 percent in March, 2008 to 5.1 percent in November, 2009), after which the labor market took over six years to repair; the unemployment rate bottomed at 2.8 percent in February, 2016.

Moreover, a sharp rise in the unemployment rate is reliably attended by a sharp fall in economic activity; economists refer to this stylized fact—which we loosely describe as a 1 percent rise in the unemployment rate corresponds to a 2 percent fall in economic activity—as Okun’s Law, named after the noted macroeconomist Arthur M. Okun. To be sure, the general notion that Okun’s Law captures informs the Sahm rule: the notion that a substantial rise in the unemployment rate signals an impending recession.
But, to date, the Sahm rule (Figure 1) does not signal recession.
Just wait…about three weeks.
The latest Sahm-rule recession indicator reading (0.30 for March, 2020) that I illustrate in Figure 1 is based on the latest unemployment rate reading (4.4 percent for March, 2020) that I illustrate in Figure 2. Since the BLS reported the unemployment rate for March, 2020, the U.S. labor market has further deteriorated. Indeed, the March reading reflects labor-market conditions sometime in the middle of the month—the so-called reference period between a Sunday and the following Saturday that includes the 12th day of the month—when the BLS gathers data from monthly survey responses of adult members of 60,000 U.S. households. Analyzing the general features of labor-market deterioration since the March BLS survey could offer a glimpse of the April, 2020 unemployment rate or, at the very least, its order of magnitude. That glimpse could, in turn, offer a glimpse of the April, 2020 Sahm-rule recession indicator and a sense of whether recession is upon the United States economy.
So, let’s have some fun, in a horrifying sort of way.
A relatively reliable leading indicator of macroeconomic labor market conditions is the number of initial claims for unemployment benefits, which the BLS reports on a weekly basis. By definition, newly unemployed individuals make initial claims for unemployment benefits; in contrast, extant unemployed individuals make continued claims. In Figure 4, I illustrate weekly initial claims in the U.S. economy for the last several decades.
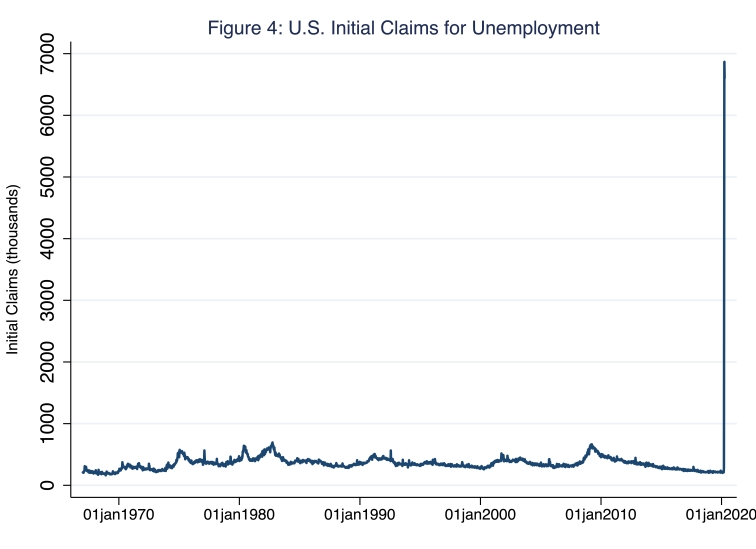
Unsurprisingly, claims are reliably countercyclical: claims for unemployment benefits rise when economic activity falls. The spike in initial claims that attended the Great Recession (barely) appears for the week that ended March 28, 2009, when claims registered 665 thousand. In contrast, in a typical week in, say, the last quarter of 2019, claims averaged 218 thousand. For the weeks ended March 21, March 28, and April 4, claims registered, respectively, 3.3 million, 6.9 million, and 6.6 million. In case Figure 4 does not place these recent numbers of claims in sufficient context, consider that the labor force in the United States numbers roughly 160 million: 16.8 million—the sum of the last three weeks of initial claims—is not an insignificant share of 160 million; more on this in a moment. Moreover, this unprecedentedly large number of claims is a macroeconomic phenomenon to which no state economy is immune. In Figure 5, for example, I illustrate weekly initial claims in South Dakota; unlike the U.S. data, these data are not statistically adjusted for monthly seasonal—and, for our purposes, largely unimportant—fluctuations, thus the regularly recurring spikes.

For the weeks ended March 21 and March 28, weekly claims registered, respectively, 1,761 and 6,801. By comparison, at roughly the same time one year ago, during the weeks ended March 23 and March 30, 2019, weekly claims averaged 160. The sum of the last two weeks of initial claims, 8,562, is 1.83 percent of the South Dakota labor force (of 467,060 individuals as of February, 2020).
Another relatively reliable leading indicator of macroeconomic labor market conditions is the number of continued claims for unemployment benefits, which the BLS reports on a weekly basis, just as it does initial claims. Continued claims rise when extant unemployed individuals do not find a job and, instead, continue to claim unemployment benefits; for this reason, economists often refer to this measure as insured unemployment. Continued claims are also reliably countercyclical: continued claims for unemployment benefits rise when economic activity falls. In Figure 6, I illustrate weekly continued claims in the U.S. economy since January, 2007, about a year before the Great Recession began.

According to Figure 6, in the weeks that ended March 21 and March 28, 2020, continued claims registered, respectively, 3.1 million and 7.5 million—the latter appears as the final data point in Figure 6; by comparison, in the (prior) week ended March 14, continued claims registered a typical 1.8 million. In rather stark contrast, nearly six quarters into the Great Recession, the number of continued claims registered, in the week that ended May 30, 2009, 6.6 million. Put differently, the number of continued claims rose more in a single week in March, 2020 than the number rose in six quarters during the worst economic contraction since World War II!
So what does this analysis of the general features of labor-market deterioration since the March BLS survey imply about the April, 2020 unemployment rate? To answer this question, I focus on the initial claims data, because individuals who filed initial claims after the BLS March reference period were likely not measured by the BLS as unemployed in March. In Table 1, I list for the last five weeks the number of initial claims (column 2), the number of individuals in the labor force (column 3), and a so-called marginal unemployment rate (column 4), which I define as the percentage-point increase in the unemployment rate from March to April, 2020 assuming, all else equal, the number of individuals who filed initial claims for unemployment benefits in the corresponding week (column 1) are measured by the BLS as unemployed in April.
Table 1: Initial Claims for Unemployment and Estimated Marginal Unemployment-Rate Effects
| Week Ended | Initial Claims | Labor Force | Marginal Unemployment Rate |
| (thousands) | (thousands) | ||
| 2020-03-07 | 211 | 162,913 | 0.13% |
| 2020-03-14 | 282 | 162,913 | 0.17% |
| 2020-03-21 | 3,307 | 162,913 | 2.03% |
| 2020-03-28 | 6,867 | 162,913 | 4.22% |
| 2020-04-04 | 6,606 | 164,022 | 4.05% |
So, for example, according to Table 1, for the week ended March 28 (row 6), 6,867 individuals filed initial claims for unemployment benefits (column 2); assuming, all else equal, that the BLS counts these individuals as (newly) unemployed in April, the April unemployment rate will rise above the March unemployment rate by 4.22 percentage points (column 4). The marginal unemployment rates for the weeks ended March 21, March 28, and April 4, are, respectively, 2.03, 4.22, and 4.05 percentage points. Thus, based only on these three weeks of initial claims for unemployment benefits, the April unemployment rate will rise by 10.30 percentage points above the 4.4 percent unemployment rate registered in March, bringing the April unemployment rate to 14.70 percent. Here I have forecasted an April unemployment rate that does not reflect additional initial and continued claims for unemployment between April 4 and the end of the April reference period (when additional individuals will claim benefits); and the administrative backlog caused by the volume of claimants attempting—in some cases, thus far unsuccessfully—to file for benefits, thus understating initial claims in the prior three weeks. (For South Dakota, based only on initial claims in the two weeks that ended March 21 and March 28 and the unemployment rate for February, this forecasting exercise implies that the April unemployment rate will be 1.83 percentage points above the 3.3 percent unemployment rate registered in February, bringing the April unemployment rate to 5.13 percent; the BLS has not yet released April claims or the March unemployment rate for individual states.)
Finally, in Figure 7, I again illustrate the Sahm-rule recession indicator; this time I add to Figure 1 my forecast of the April, 2020 Sahm rule indicator, which I used the Sahm-rule algorithm to calculate based on my hypothetical—though, sadly, not unreasonable—April unemployment-rate forecast of 14.70 percent.
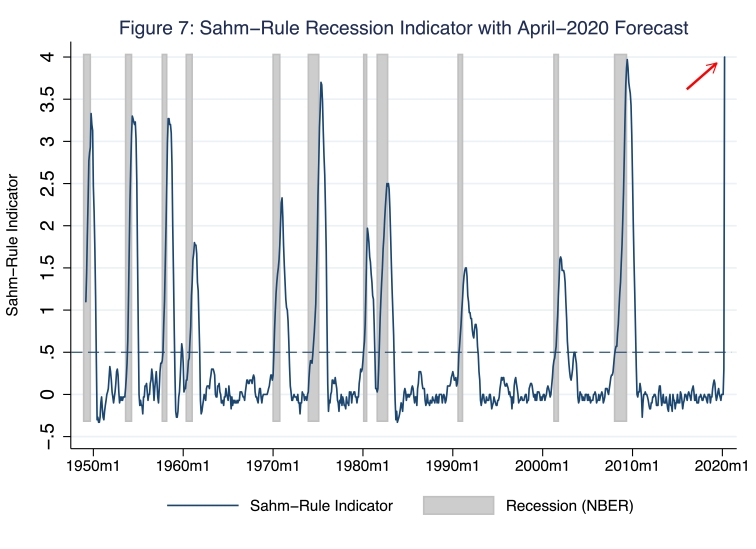
Based on my analysis, the Sahm-rule recession indicator will register a value of 4, which I identify in Figure 7 with a red arrow. Recall, according to the Sahm rule, an indicator value above 0.50 reliably predicts an impending recession.
It is neither a matter of if nor when: trouble is upon the U.S. economy. Nevertheless, we need not fret; instead, we must work the problem. There is no doubt that the U.S. economy has exited the longest peacetime expansion in U.S. history; but it did so because of an exogenous—and, more specifically, epidemiological as opposed to economic—shock. Consider the corollary: if ever an economy were well positioned to countenance the economic threat posed by the novel coronavirus, it is the current U.S. economy, in which the labor force, human and physical capital stocks, institutions, and technologies remain intact, the financial system remains well capitalized, and public-sector financial capacity remains high. A rational, nonpartisan, and humane policy mix of monetary and fiscal macroeconomic stabilization and stimulation is the achievable solution to the problem the U.S. economy now confronts.

Outstanding assessment. Thnx Prof Joe. Keep it up through these unique times into the summer, fall, winter 2020-2021 & beyond.
LikeLike