
This blog post accompanies the SDPB Monday Macro segment that airs on Monday, November 6, 2023. Click here to listen to the segment. For more macroeconomic analysis, follow J. M. Santos on Twitter @NSMEdirector.
On Friday, November 3, 2023, the U.S. Bureau of Labor Statistics released its October 2023 Employment Situation—the monthly jobs report, as we know it well. According to the report, employers added 150,000 jobs in October—about half the number of jobs employers added in September—while the unemployment rate rose slightly to 3.9 percent and wage pressures eased some.
About the report, the Wall Street Journal remarked:
If sustained, a hiring pullback is likely to bring the Federal Reserve’s historic interest-rate increases to an end by providing stronger evidence that higher borrowing costs have slowed the economy. The report could also mollify concerns that brisk consumer spending this summer would lead hiring or wages to reaccelerate.
WSJ, November 3, 2023, by David Harrison and Nick Timiraos
Seems to me the upshot of the Wall Street Journal story is that the labor market is revealing the contractionary effects of tight Federal Reserve monetary policy and, so, the central bank may be nearing the end of its tightening cycle. To be sure, the stock market rallied in response to the report. Nevertheless, I reason wage pressures generally remain too strong to be consistent with low and stable inflation, which of course the central endeavors to achieve.
Essentially, macroeconomists reason upward pressure on nominal wages—driven, perhaps, by upward pressure on expectations of inflation—could cause upward pressure on inflation more generally. Supply-and-demand theory teaches that tight labor markets bid up the price of labor; this is to say, tight labor markets unleash wage wars. The reason is straightforward enough. To fill a labor shortage, employers bid the wage—the price of labor services—higher as employees seek to preserve or gain purchasing power eroded, in part, by inflation.
The bidding war has two effects that return the labor market to equilibrium: the quantity of labor demanded falls, because as the price of labor services rises, some employers can no longer justify hiring more labor (and so perhaps these would-be employers automate instead, for example); and to the extent possible, the quantity of labor supplied rises, because as the price of labor services rises, newly employed persons join the labor market. In effect, higher wages draw persons into employment whether from within or from outside the labor force. If persons are not available to be drawn into employment, wage pressures are greater than otherwise.
A popular—if imperfect—macroeconomic measure of the hourly wage in the United States is average hourly earnings, which I illustrate in Figure 1 for private production and nonsupervisory employees.
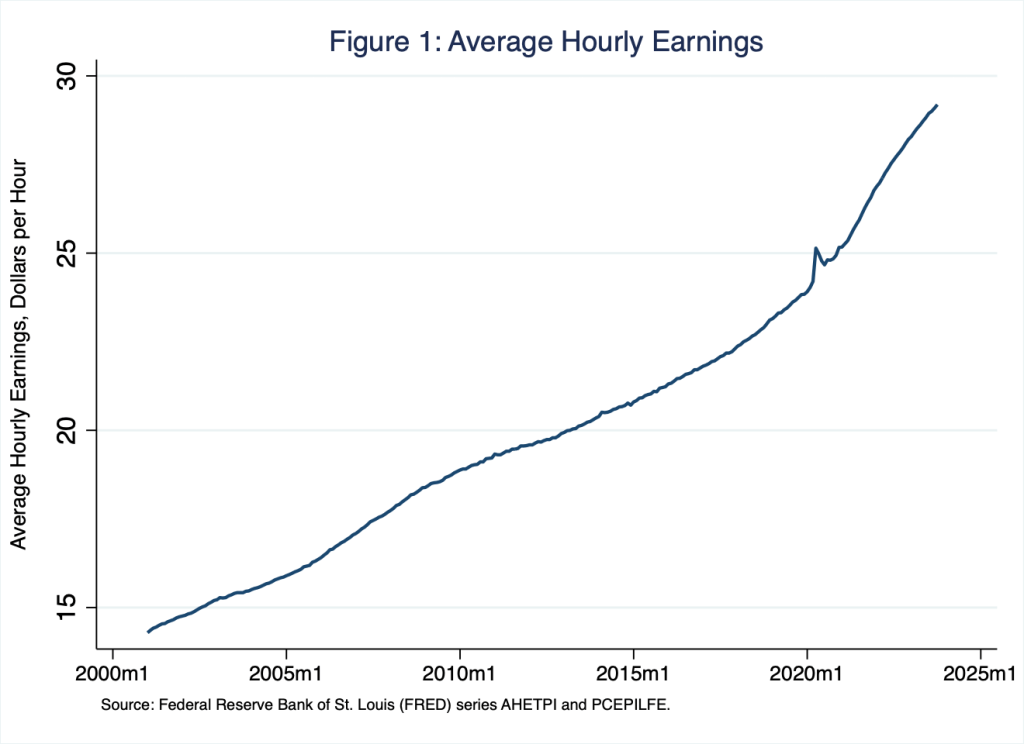
According to Figure 1, average hourly earnings has risen consistently over time. As of October 2023, the measure registered $29.19 per hour. Average hourly earnings is a nominal economic variable; the unit of account we use to assign value to the measure is a current dollar amount: $29.19 as of October 2023 or $19.79 as of October 2012, for example. Because the average price level changes over time, from the values in Figure 1 alone we cannot discern the amount of goods and services $29.19 purchases relative to amount of goods and services $19.79 purchases, for example. To learn the purchasing power of these and other such nominal measures, we must know how the average price level changes over time; this is to say, we must know the rate of inflation, which we define as the growth rate of the average price level.
In Figure 2, I illustrate the rate of inflation based on the personal consumption expenditures chain-type price index excluding food and energy—the measure of core inflation the Federal Reserve tracks and targets.
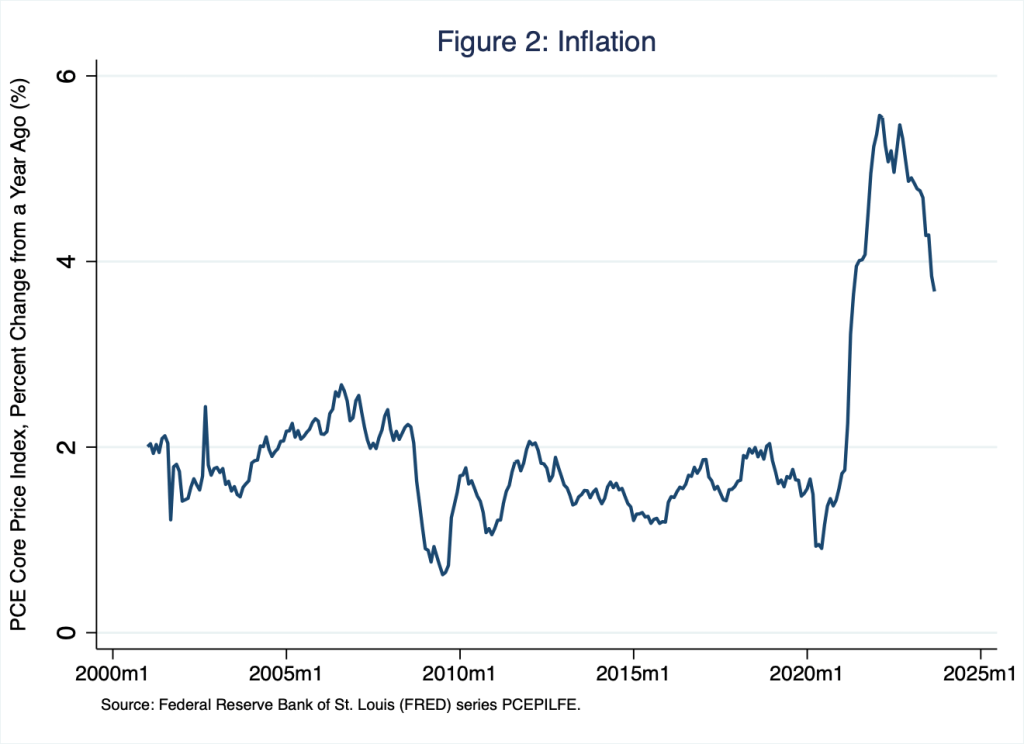
As Schooled readers know well, according to Figure 2, the rate of inflation remained in the neighborhood of two percent until shortly after the pandemic, when it rose to nearly six percent. As of September 2023, the rate registered 3.7 percent, still significantly above the central bank’s target of 2 percent.
By dividing the nominal wage illustrated in Figure 1 by the average price level that I used to compute the rate of inflation illustrated in Figure 2, we learn the purchasing power of average hourly earnings relative to a base year: 2017 in this case, because 2017 is the base year of the average price level that I used to compute the rate of inflation in Figure 2. We can think of the inflation-adjusted measure of the nominal wage (Figure 1) as the real wage—the amount of goods and services the nominal wage in a given year purchases relative to the amount of goods and services the nominal wage in 2017 purchases.
In Figure 3, I illustrate nominal average hourly earnings—think, the nominal wage (Figure 1)—and real average hourly earnings—think, the real wage, which I compute by dividing the nominal wage by the average price level.
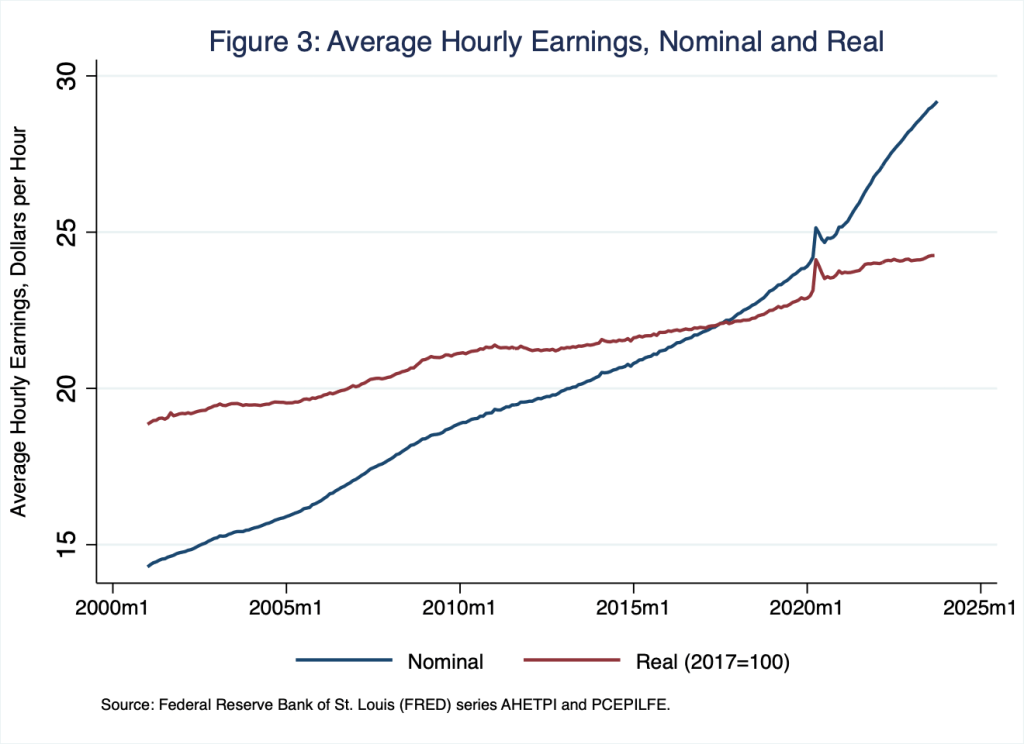
The lines in Figure 3 cross (at roughly $22 per hour) in 2017, because 2017 is the base year: thus, in 2017, the nominal wage of $22 per hour purchased what $22 purchased in 2017—obvious, I know. This is more interesting if we think about it outside the base year. So consider September 2023, when the nominal wage (Figure 3; blue line) registered $29 per hour and the real wage (Figure 3; red line) registered $24 per hour: thus, in September 2023, the nominal wage of $29 per hour purchased what $24 purchased in 2017. Or, put differently, from 2017 to September 2023, the nominal wage increased by 32 percent ($29 per hour / $22 per hour); meanwhile, the real wage increased by 9 percent ($24 hour / $22 per hour). From 2017 to September 2023, the growth rate of the average price level was the difference between the growth rate of the nominal wage and the growth rate of the real wage: that is, 23 percent is the difference between 32 percent and 9 percent.
In Figure 4, I illustrate growth in nominal and real average hourly earnings from 2001 to 2019; I end the sample just prior to the start of the pandemic because the behavior of average hourly earnings during the pandemic is exceptional and outsized, as you can see from the spikes in Figures 1 and 3 during the pandemic; I illustrate the full sample, including data registered during the pandemic, in Figure 5.
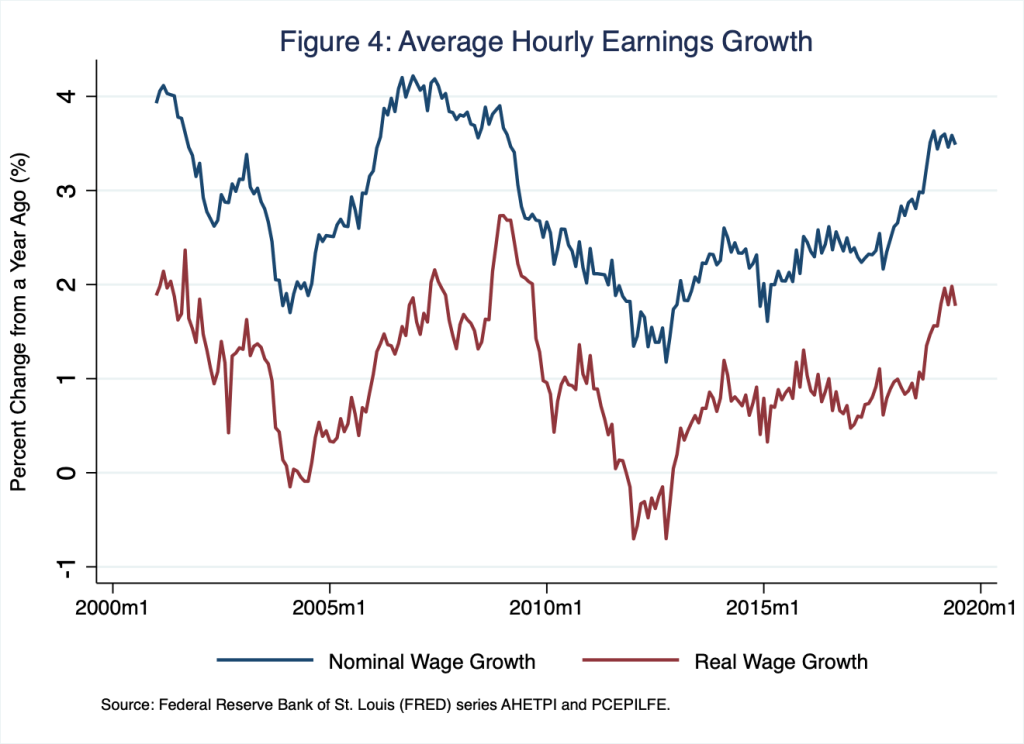
In Figure 4, the effect of inflation on the purchasing power of the nominal wage (blue line) is evident. Because inflation is a consistent feature of the U.S. economy, and because inflation erodes the purchasing power of money, the growth rate of the real wage is consistently below the growth rate of the nominal wage—the red line is consistently below the blue line. Put differently, the growth rate of the nominal wage is driven by the growth rate of the average price level—think, inflation—plus the growth rate of purchasing power; whereas the real wage is driven by the growth rate of purchasing power, only.
In Figure 5, I illustrate the full sample, including data registered during the pandemic.
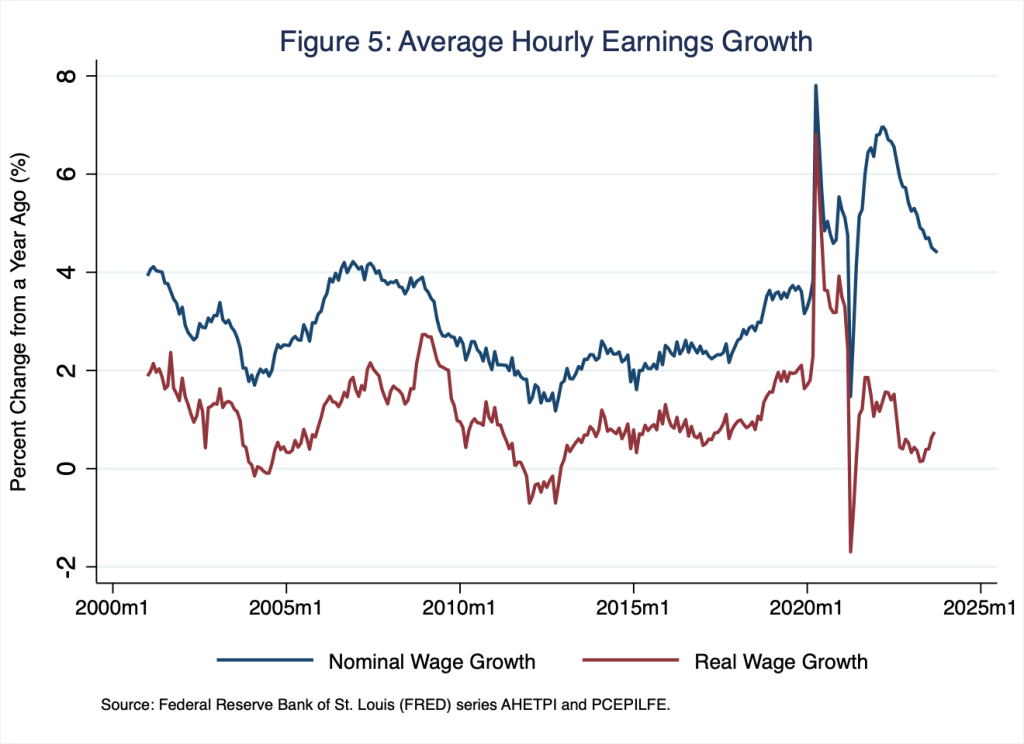
According to Figure 5, during the pandemic, growth of average hourly earnings rose dramatically and then fell dramatically, exceptional and outsized behavior that is an artifact of how the U.S. Bureau of Labor Statistics computes average hourly earnings, the ratio of total earnings to total hours worked, in this case by private production and nonsupervisory employees. During the pandemic, when twenty million individuals suddenly exited employment, the number of private production and nonsupervisory employees—the denominator in the average hourly earnings measure—suddenly fell; thus, average hourly earnings suddenly rose. The pattern reversed when individuals, including those reflected in the measure of average hourly earnings, returned to work. Thus for good reason, macroeconomists generally disregard the behavior of average hourly earnings during and shortly after the pandemic.
Finally, an alternative, more-comprehensive, and, for most macroeconomists, preferred measure of employee compensation, broadly defined, is the employment cost index. The index tracks public- and private-sector workers and includes the costs of benefits. Additionally, the index controls for compositional shifts in the labor force: for example, because the index assumes the share of workers employed in, say, private production and nonsupervisory jobs is fixed, the index does not shift during the pandemic in the way average hourly earnings does.
One drawback of the index, relative to average hourly earnings, is that the index is not terribly relatable: it is an index, as opposed to, say, a dollar amount per hour, after all. Nevertheless, dividing the nominal employment cost index by the average price level—again, the personal consumption expenditures chain-type price index excluding food and energy I used to compute the rate of inflation illustrated in Figure 2—yields a real employment cost index. In Figure 6, I illustrate the year over year growth rates of the nominal and real employment cost indexes, which are sensible measures of nominal and real compensation, broadly defined.
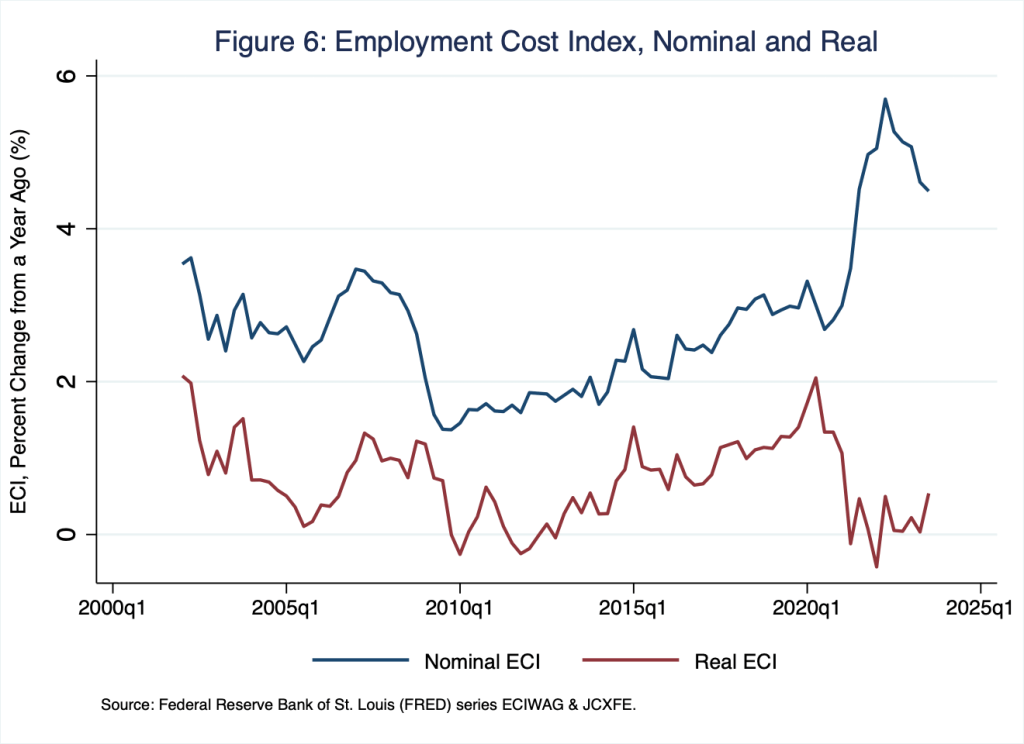
For the most recent data, the patterns in Figures 5 and 6 are similar: nominal compensation has recently grown year over year by 4.5 percent, while real compensation has grown year over year by .75 percent (based on average hourly earnings) or .5 percent (based on the employment cost index). For macroeconomists, the takeaway, believe it or not, is nominal compensation, however we measure it, is growing too fast; inflationary forces remain in the labor market, where roughly three quarters of GDP, measured as income, is earned.
A high wage is a good thing, no?
To macroeconomists, a nominal wage consistent with low and stable inflation—think, two percent—is a good thing. Generally speaking, macroeconomists think about the aggregate nominal wage—empirically, think, average hourly earnings or the employment cost index—as a function of labor productivity and the average price level, where we define labor productivity as the amount of output produced from an hour of labor services, the input. Thus, we think about the growth rate of the aggregate nominal wage as the the growth rate of labor productivity plus the rate of inflation.
In a macroeconomic equilibrium with low and stable inflation, then, the aggregate nominal wage grows at the growth rate of productivity plus the central bank’s target rate of inflation, which we know is 2 percent; put differently, the real wage grows at the growth rate of productivity, and the rate of inflation equals the central bank’s target.
In Figure 7, I illustrate the actual year-over-year growth rate of labor productivity (blue line) and its smoothed counterpart (red line), which offers us a good visual sense of the prevailing behavior of labor productivity over time.
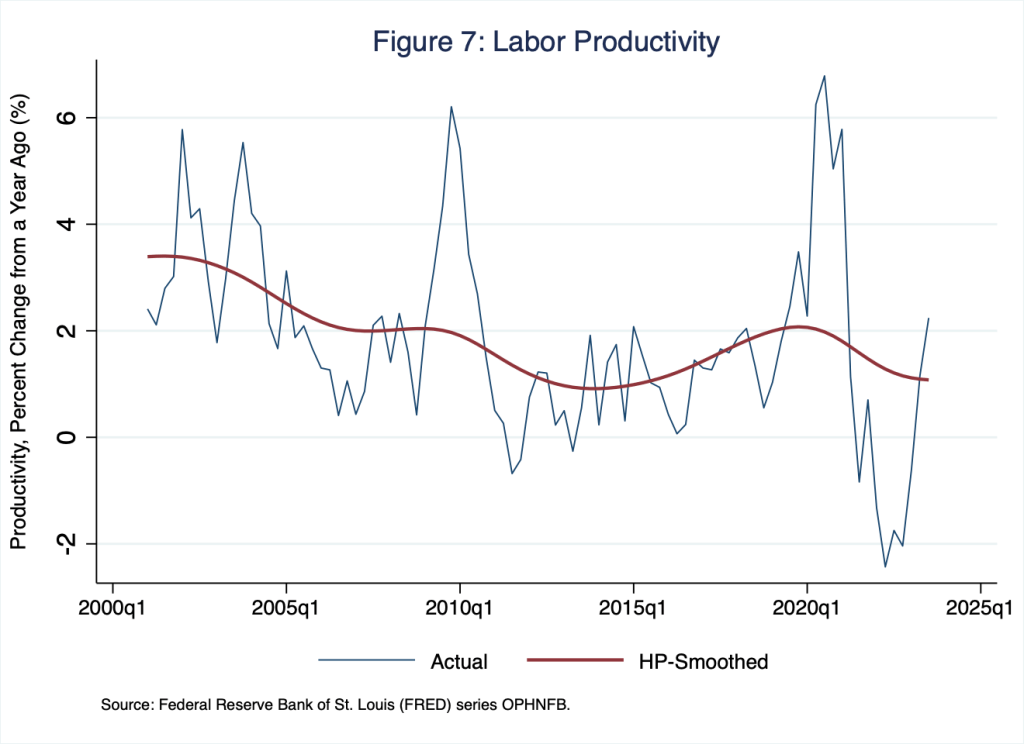
According to the smoothed series in Figure 7, the growth rate of labor productivity registered about 1.1 percent in the third quarter of 2023, though the actual (noisy) measure is above 1.1 percent. Let’s assume for the sake of argument that a growth rate of labor productivity between 1 and 1.5 percent prevails in equilibrium. In this case, the growth rate of the aggregate nominal wage consistent with low and stable inflation—again, think, two percent—is between 3 (2 percent inflation plus 1 percent productivity growth) and 3.5 percent (2 percent inflation plus 1.5 percent productivity growth), in which case the growth rate of the aggregate real wage would equal the growth rate of labor productivity. We could think about the transition to long-run equilibrium graphically as the blue and red lines in Figure 6 approaching, say, 3.5 percent and 1.5 percent, respectively; while the gap between the two lines approaches 2 percent, the central bank’s target rate of inflation.
Thus, at 4.5 percent, the growth rate in the aggregate nominal wage, whether we measure it according to average hourly earnings or the employment cost index, is between 1 and 1.5 percent higher than macroeconomists—including Federal Reserve policymakers—reason it should be if the central bank is to achieve its target rate of low and stable inflation. To monetary policymakers, the takeaway is straightforward: wage pressures continue to signal that monetary policy should remain tight; interest rates, high as they may seem now, should remain so or perhaps go higher to quell inflationary pressures—those emanating from the labor market and otherwise.
Yet another reason why interest rates must stay higher for longer.
