
This blog post accompanies the SDPB Monday Macro segment that airs on Monday, July 1, 2024. Click here to listen to the show. For more macroeconomic analysis, follow J. M. Santos on Twitter @NSMEdirector.
For the last Monday Macro segment, I sat down with SDPB’s Lori Walsh to discuss the seeming disconnect between the relatively strong performance of the U.S. economy and the relatively weak sentiment of the average U.S consumer. Our discussion reminded me of the famous quip by Nobel Laureate Robert Lucas in his review of Manufacturing Matters: The Myth of the Post-Industrial Economy (by Stephen S. Cohen and John Zysman, Basic Books, 1988). In the review, Lucas noted the authors could not explain the seeming disconnect between the relatively weak performance of U.S. labor-productivity growth and the ostensible proliferation of information technology (which, economists reason, should increase labor-productivity growth). About the disconnect Lucas famously quipped, “You can see the computer age everywhere but in the productivity statistics.” That is, the productivity statistics—the data—seemed independent of the proliferation of a computer technology that everyone expected would increase labor productivity.
Today, we face an analogous, albeit reversed, disconnect: the general features of the U.S. economy imply it is performing well, but you would be forgiven for thinking otherwise, because the average consumer seems quite underwhelmed, if not outright discontented, with the U.S. economy. To play on Lucas’s famous quip, you can see the relatively strong performance of the U.S. economy everywhere in the data, but not in the hearts and minds of consumers.
During the last show, Lori and I concluded, as have many others, that the inflation rate must be driving consumer discontent with the U.S. economy, a perfectly elegant explanation, if only it worked in theory. It sort of mostly only works in practice. Indeed, the prevalence of household discontent toward inflation absent a strong theoretical argument for the discontent has a macroeconomic name: the inflation fallacy, which is that a rise in the average price level implies a loss in the purchasing power of nominal income. In theory, a rise in the average price level implies no loss in the purchasing power of nominal income. In the parlance of monetary economics, money is neutral, affecting only nominal as opposed to real variables in the long run (and, to a large extent, in the short run, too).
To isolate the inflation rate as the principal cause of consumer discontent and, then, to evaluate the inflation fallacy, consider, for example, three general features of the U.S. economy: namely, the unemployment rate, the output gap, and the inflation rate. In Figure 1, I illustrate the unemployment rate, the number of unemployed individuals as a fraction of the labor force—the sum of unemployed individuals and employed individuals.
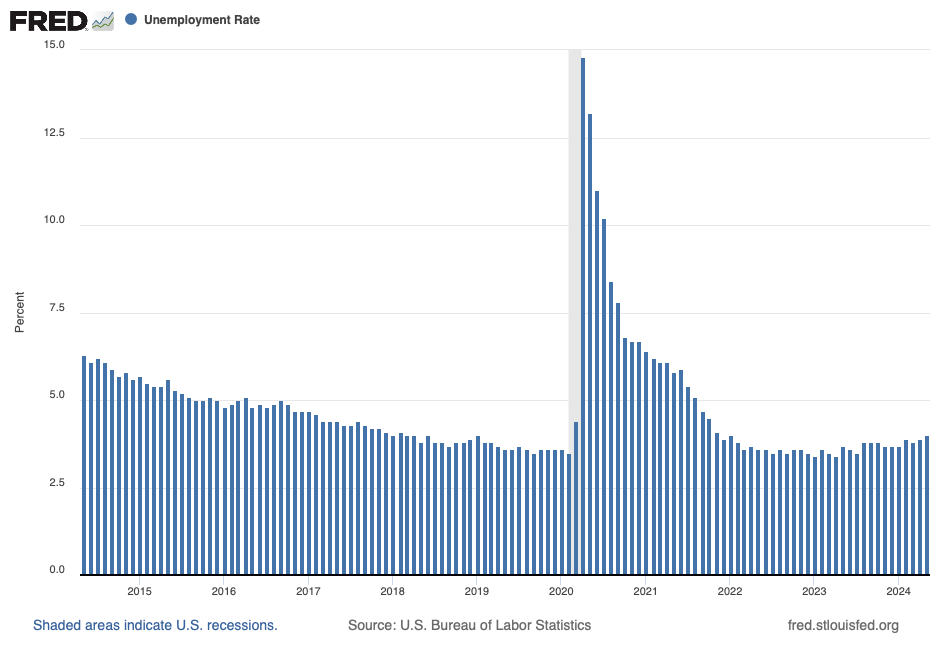
In May 2024, the unemployment rate registered 4 percent—the data point represented by the rightmost bar in Figure 1. To know if 4 percent is high or low, we must know the natural unemployment rate. Economists do not compare, say, a 4-percent unemployment rate to a zero-percent unemployment rate, because the unemployment rate never drops to zero. Rather, economists reason the unemployment rate approaches its natural rate—the one the economy achieves in the long run, when economic output has reached it potential level and, thus, cyclical unemployment is zero.
Put differently, the natural rate of unemployment is greater than zero because, at any moment, some fraction of the labor force is either searching or waiting for job openings. By definition, searching for a job opening creates frictional unemployment, which economists expect in a dynamic, free-enterprise economy; types of skills and types of jobs are heterogeneous, so matching skills to available jobs takes time and effort.
Whereas waiting for a job creates structural unemployment, which economists attribute to wages set above market-clearing levels (because of collective-bargaining power or market imperfections such as asymmetric information, for example). In this case, the quantity of labor supplied exceeds the quantity of labor demanded no matter how hard unemployed individuals search for job openings; for the economy as a whole, searching does not reduce structural unemployment in principle.
Given some level of structural unemployment, which we reason is relatively stable over time, the economy achieves the natural rate of unemployment when the number of unemployed individuals who find jobs in a given month at the long-run job-finding rate is equal to the number of employed individuals who separate from jobs in a given month at the long-run job-separation rate. We could quibble about how best to measure the natural rate of unemployment, but reasonable measures typically fall in the neighborhood of, well, 4 percent; for example, the Congressional Budget Office estimates the natural rate—aka, the non-cyclical rate of unemployment—was 4.4 percent in the second quarter of 2024. Thus, currently, the U.S. economy is performing well according to the unemployment data.
Meanwhile, in Figure 2, I illustrate the output gap—the difference between actual and potential real GDP as a percentage of potential real GDP; the output gap is necessarily a counterfactual estimate of economic output if the economy were fully employing all its resources.
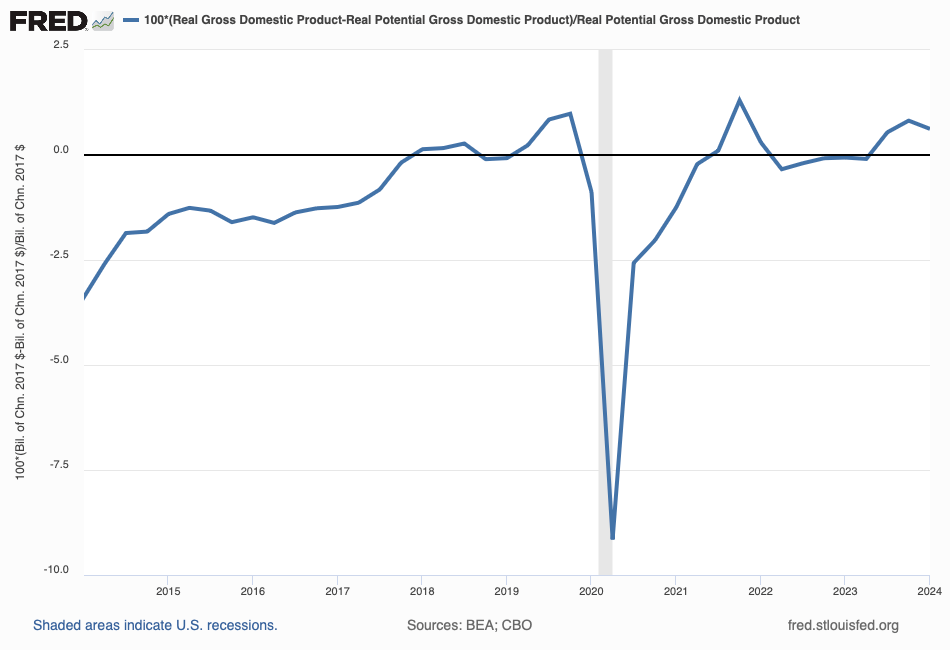
In Figure 2, I include a black reference line at the y-axis value of a zero output gap—the gap is zero percent of potential real GDP, because actual and potential real GDP are equal at the point of a zero output gap. Where the actual output gap intersects the black reference line, the economy is operating at full capacity. Likewise, where the gap is above [below] the black reference line, the economy is operating above [below] its potential (and, incidentally, all else equal, the appropriate tactical response is for the Fed to raise [lower] its target range for the federal funds rate, a topic for another day). In the first quarter of 2024, the output gap was positive and equal to 0.62 percent of potential output. Thus, currently, the U.S. economy is performing well according to the output gap.
Finally, in Figure 3, I illustrate the inflation rate based on the personal consumption expenditures index—overall and core, which excludes food and energy prices.
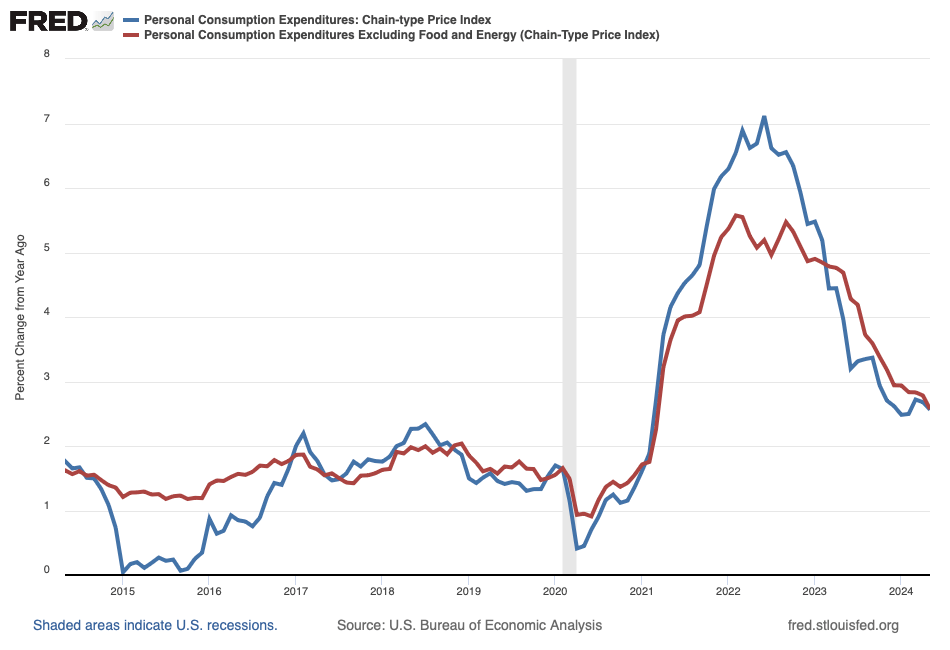
Schooled readers and Monday Macro listeners know the drill: since the pandemic, extraordinary growth in aggregate demand fueled by extraordinary growth in fiscal and monetary policies—think, stimulus checks and near-zero interest rates, respectively—combined with contractions in aggregate supply—think, supply-chain troubles—reduced the purchasing power of money. After the pandemic, the inflation rate rose substantially; recently the rate has slowed. As of May 2024, the inflation rate, measured as the overall rate or as the core rate, registered about 2.6 percent year-over-year growth, less than a percentage point above the Federal Reserve target of 2 percent. Thus, currently, the U.S. economy is performing mostly well according to the inflation rate.
Of the three general features of the U.S. economy, the inflation rate is the one on which the economy could improve, because the rate registers above 2 percent, what the Federal Reserve and most other central banks define as price stability. Indeed, the inflation rate—or, in the parlance of the average consumer, the rise in prices—is surely driving the seeming disconnect between the relatively strong performance of the U.S. economy and the relatively weak sentiment of the average U.S consumer.
In fairness to the average consumer, although the inflation rate may be falling, the price level (which grows at the inflation rate, by definition) is higher today than the price level would have been had the post-pandemic high inflation rate not occurred. Put differently, the prices of goods and services are higher today than they would have been had the inflation rate remained at or below 2 percent after the pandemic. And the average consumer has noticed the higher-than-otherwise price level, about which the average consumer is discontented.
Just because the consumer is discontented does not mean they perceive the effects of inflation accurately.
Hyperinflations aside, mild doses of price instability imposed by, say, inflation rates between 2 and 8 percent annually, do not substantially or persistently distort real income, including the household real income that consumers earn. In theory, inflation is a rise in the average price level. And, because a price measures the value of a transaction between a buyer (who pays the price) and a seller (who receives the price paid), expenditures—think, what buyers incur—and incomes—think, what sellers earn—must equal. Thus, an average rise in the price level is reflected in the average rise of nominal income. For example, if prices rise by 5 percent on average, then so too does nominal income, leaving the purchasing power of nominal income—aka, real income—unchanged on average. Thus the notion, widely held by consumers and others, that a rise in the average price level implies a loss in the purchasing power of nominal income is a fallacy. (In contrast, a rise in the average price level necessarily implies a loss in the purchasing power of money, of course.)
All this is not to say inflation is harmless. On the contrary, inflation changes incentives and, thus, distorts economic activity, because inflationary forces typically do not simultaneously raise the prices of all goods and services by the same proportion at the same moment in time. In the short run, inflation changes relative prices—the price of corn relative to the price of oil, for example. Allocating resources efficiently depends on prices moving relative to one another because of the microeconomic market forces of supply and demand, not because of macroeconomic changes in the purchasing power of money. Worse yet, if inflationary forces are volatile, as they tend to be when inflation rates are relatively high, the disruption to economic activity is greater still. Moreover, inflationary forces discourage buyers and sellers from entering into long-term contracts, an institutional arrangement on which robust economic growth relies. The problem is that prices set by long-term contracts necessarily do not adjust to unexpected inflation, which capriciously redistributes income between parties to the contract. For example, unexpected inflation redistributes income from lenders to borrowers. Knowing this, buyers and sellers avoid long-term contracts when the path of inflation is uncertain.
Fishing for discontent.
Indeed, the redistribution of income between borrowers and lenders imposed by unexpected inflation may explain why some consumers—specifically, those who recently locked in long-term debt at relatively high interest rates—are discontented. The explanation is based on the relationship between nominal and real interest rates and something macroeconomists call the Fisher effect.
The nominal interest rate is the stated yield to maturity of a debt instrument, such as a government bond, a car loan, a credit-card loan, or a home-mortgage loan. As such, the nominal interest rate measures the return to lenders—and, thus, the financing cost to borrowers—in terms of dollars. In Figure 4, I illustrate the nominal interest rate on the 30-year, conventional, fixed-rate mortgage loan, which is effectively sold by homebuyers—consumers who recently locked in long-term debt at relatively high interest rates, say—and bought by savers, through banks acting as intermediaries, as a practical matter.
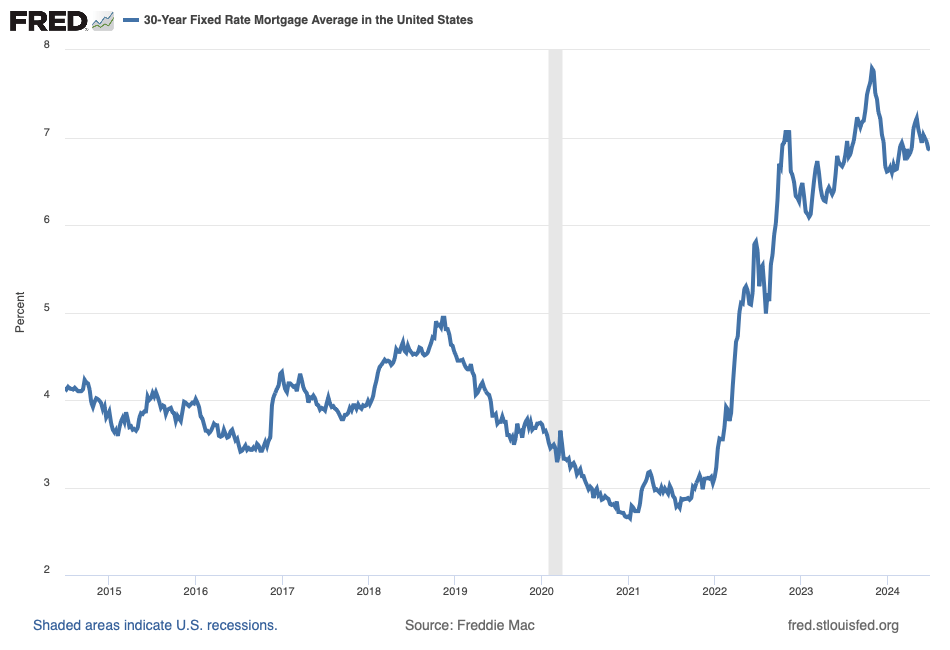
During the time period illustrated in Figure 1, mortgage-loan rates range from roughly 2.65 to 7.76 annual percentage points. Take, for example, the mortgage-loan rate 6.86 percent, which registered the week of June 27, 2024; for every $100 a homebuyer borrowed that week, they agreed to pay $6.86 of interest one year later (assuming, for simplicity, the homebuyer paid only interest on the mortgage loan). Because 6.86 percent is a nominal interest rate, it does not convey the purchasing power of $6.86 in terms of the value of money at the time the homebuyer borrowed the $100. For example, will $106.86—the $100 the homebuyer borrowed plus the $6.86 of accrued interest—purchase 6.86 percent more goods and services than $100 purchased the week of June 27, 2024? If not, the nominal interest rate differs from the real interest rate, which measures the return to lenders—and the financing cost to borrowers—in terms of (real) purchasing power.
The difference between nominal and real interest rates is the expected inflation rate. The relationship between nominal interest rates, real interest rates, and expected inflation rates occurs because of fierce competition among borrowers and lenders who effectively “price” into nominal interest rates—and, thus, the terms of a loan contract—expected inflation rates in an attempt to secure some desired real interest rate. The process of pricing expected inflation into nominal interest rates is called the Fisher effect, named for Irving Fisher, a leading early twentieth-century American economist.
During the last year or so, nominal 30-year mortgage-loan rates have increased by more than expected inflation rates have increased, thus real mortgage-loan rates have increased, as well. In Figure 5, I illustrate nominal (blue) and real (red) 30-year mortgage-loan rates, where the real rate is the nominal rate I illustrate in Figure 4 minus the 30-year expected inflation rate.
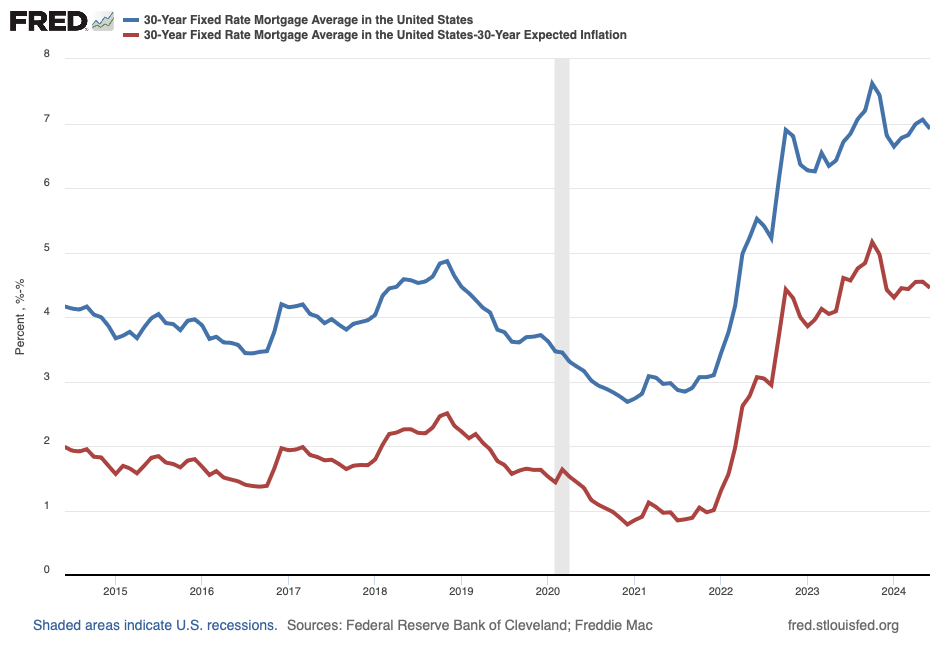
Essentially, expected inflation rates have not increased one-for-one with actual inflation rates. Put differently, relative to actual inflation, expected inflation has remained anchored (around 2.5 percent). On balance, markets reason the relatively high rates of inflation we observed recently are not likely to persist. The upshot for consumers who recently locked in long-term debt at relatively high nominal interest rates is that they locked in long-term debt at relatively high real interest rates, as well. Thus, although the prevalence of deep household discontent toward relatively high inflation lacks a strong theoretical foundation, because a rise in the average price level does not imply a loss in the purchasing power of nominal income, relatively high inflation has imposed a real burden on consumers who find themselves paying higher real interest rates, a situation about which consumers could be forgiven for feeling discontented.
