
This blog post accompanies the SDPB Monday Macro segment that airs on Monday, July 7, 2025. Click here to listen to the segment.
When asked about her third album, released May 2024 and titled, Radical Optimism, pop-star Dua Lipa remarked, in part, “I want to just move on and grow…every experience is a lesson.” Economists would agree: when asked to measure the quality of life, economists often turn to some measure of growth, which we attribute to learning—every experience is a lesson, indeed. We often choose as our measure of growth some measure of income per capita.
The logic is simple, if only a bit too simple: the greater the outcomes of economic activities born of mutually beneficial trade in competitive, complete markets, the better, full stop. Issues of distribution—think, who benefits from the outcomes—are complicated of course, but determining how best to distribute more income is easier than determining how best to distribute less income. Not all markets are competitive and complete, but thinking about raising income per capita is a good place to start when thinking about raising quality of life, or so we reason.
My outlook for raising income per capita in the U.S. and specifically in South Dakota—home of Schooled and Monday Macro—is optimistic, though not radically so. My optimism is bounded because economic growth is bounded. Understanding the boundaries of economic growth allows us to optimize it, a process that, as I explain in this blog post, requires sensibly regulated and publicly supported market capitalism, complete with private-public partnerships that incentivize knowledge creation and ensure free enterprise and property rights. Economic growth isn’t magic; it requires sound economic reasoning and policies, not a Houdini—sorry, I couldn’t resist; IYKYK.
Economists measure income in various ways. In this post, I focus on personal income, which the Bureau of Economic Analysis (BEA) defines as the income an individual receives before taxes from all sources—from production, ownership of a home or business, ownership of financial assets, and government transfer payments, for example. We can express personal income per capita as 
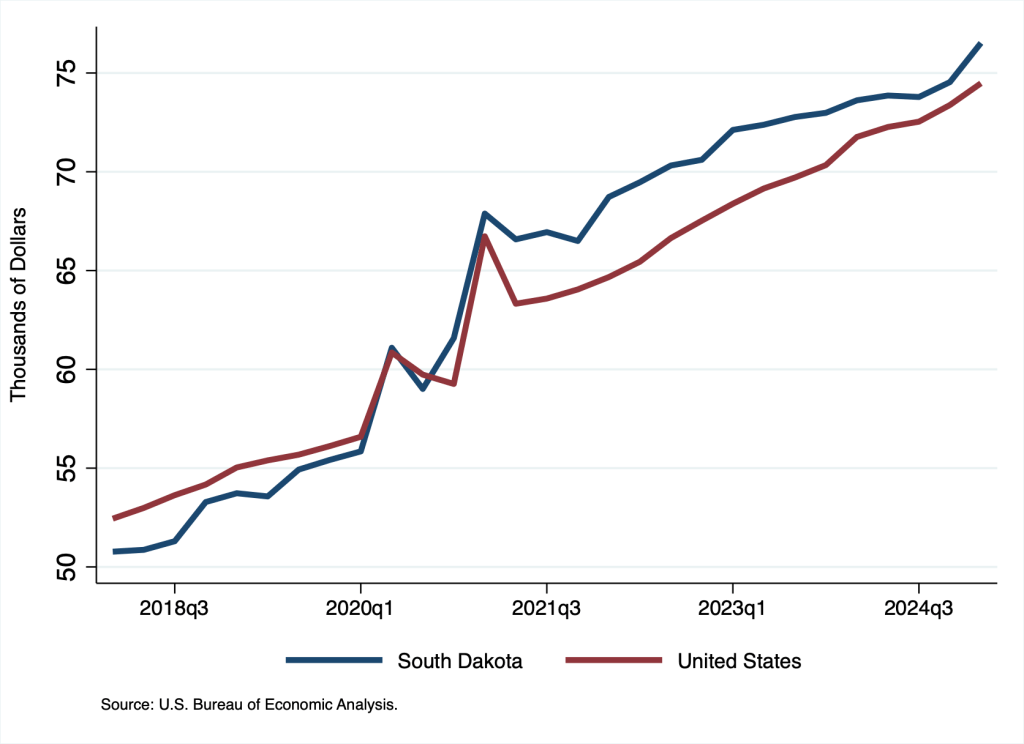
According to Figure 1, personal income per capita has grown somewhat steadily over time. The two spikes during the pandemic reflect government stimulus payments that raised personal income dramatically. Since the pandemic, personal income per capita in the state (blue line) has led personal income per capita in the nation (red line).
The growth in personal income per capita in the state and the nation primarily reflects economic growth (as opposed to growth in government transfer payment, say). To understand the sources of personal income per capita, consider the following expression, in which I decompose personal income per capita (on the lefthand side of the expression) into four components (on the righthand side of the expression).

In plain English, the four components are the average personal income earned for an hour worked by an employee 


Ironically, although growth is by definition a dynamic process, most of the drivers of personal-income growth are, well, not terribly dynamic, because they are bounded from above or below. First, the average number of hours an employee works
Second, the employment rate

For
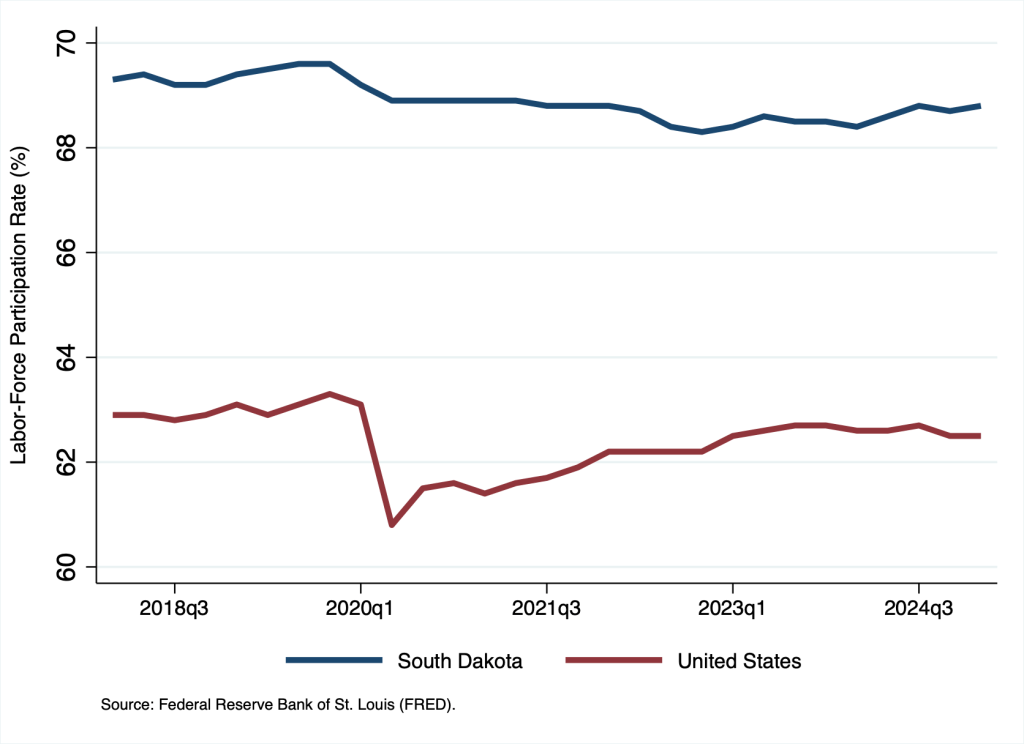
And third, the labor-force participation rate
For
So what’s left to drive economic growth?
In the context of personal income per capita, according to the decomposition above, the term, 
In Table 1, I decompose personal income per capita for South Dakota and the U.S. in the first quarter of 2025, when personal income per capita registered $76,521 for South Dakota and $74,481 for the U.S.
 |  |  |  | |
| South Dakota | $76,521 | $113,377 | 98.1% | 68.8% |
| U.S. | $74,481 | $124,264 | 95.9% | 62.5% |
Source: Bureau of Economic Analysis.
In the third column of the table, I report ![\left[\frac{\text{p.income}}{\text{hours}} \times \frac{\text{hours}}{\text{employees}}\right]](https://s0.wp.com/latex.php?latex=%5Cleft%5B%5Cfrac%7B%5Ctext%7Bp.income%7D%7D%7B%5Ctext%7Bhours%7D%7D+%5Ctimes+%5Cfrac%7B%5Ctext%7Bhours%7D%7D%7B%5Ctext%7Bemployees%7D%7D%5Cright%5D&bg=3e4244&fg=e6edf0&s=0&c=20201002)

Table 1 reveals the constraints—the upper and lower bounds, as it were—on the growth of personal income per capita and thus, economic growth more generally and the importance of labor productivity. Consider the case of South Dakota, for example. For personal income per capita ($76,521 in 2025 Q1) to grow over time, some combination of productivity plus ($113,377 in 2025 Q1), the employment rate (98.1 percent in 2025 Q1), and the labor-force participation rate (68.8 percent in 2025 Q1) must grow over time. But of course, the employment rate is bounded above by 100 percent (because the unemployment rate is bounded below by 0), while the labor-force participation rate is bounded above by demographic and migratory forces.
In South Dakota, patterns of labor migration have changed since the pandemic. In Table 2, I report population change from April 1 2020 to July 1, 2024, during which the population of the state rose by 37,940.
| Population Change | Natural Change | Net Migration | International | Domestic |
| 37,940 | 9,387 | 28,035 | 6,665 | 21,370 |
| 25% | 74% | 18% | 56% |
Source: U.S. Census Bureau.
Three quarters of the change (28,035 of 37,940) occurred through net migration, much of it (21,370 of 37,940; 56 percent) driven by domestic entrants to South Dakota. The data support the stories we often heard about U.S. residents choosing to call South Dakota home during and immediately after the pandemic.
As I report in Table 3, more recently, the population of the state rose by 6,364 (in the span of twelve months). Compared to the data in Table 2, a smaller share of the change (3,748 of 6,364; 59 percent) occurred through net migration, and a smaller share (2,132 6,364; 34 percent) was driven by domestic entrants to South Dakota.
| Population Change | Natural Change | Net Migration | International | Domestic |
| 6,364 | 2,588 | 3,748 | 1,616 | 2,132 |
| 41% | 59% | 25% | 34% |
Source: U.S. Census Bureau.
No doubt, net migration will continue to drive labor-force participation in the state. Nevertheless, the primary driver of economic growth in the state and otherwise will remain labor productivity.
So what drives productivity?
The amount of capital, like the machines and tools with which we equip labor, the skills, knowledge, and experience labor accumulates—think, human capital—and the production technology—the recipes with which we combine labor and physical and human capital—drive labor productivity. Thus, over time, increases in the amount of physical and human capital and improvements in technology grow labor productivity. The most effective ways to sustain economic growth through labor-productivity growth is to deepen human capital and improve technology.
The processes that deepen human capital and improve technology combine private- and public-sector efforts directly and indirectly, because knowledge is nonrival. The use of knowledge—a public good—in one context does not prohibit the use of knowledge in another context. Put differently, the marginal cost of supplying knowledge to an additional user of the knowledge is effectively zero; sharing with an additional individual that two plus two equals four is effectively costless, for example. Thus, the creation and distribution of knowledge cannot be governed exclusively by competitive market forces, which on their own would price the supply of knowledge at marginal cost (of zero), leaving no incentive to produce knowledge.
Most economists reason knowledge creation is a largely endogenous process, an outcome of competitive interactions of firms maximizing shareholder value and operating in an economic environment that incentivizes activities to increase private and social returns. The economic environment requires private-public partnerships of various sorts. Examples include public support for basic research, rights for a limited time to exclusive use of research-and-development outcomes, programs for workforce development, and opportunities for financing private activities that yield social returns (because some learning requires doing, for example).
When the macroeconomic objective is economic growth, which depends crucially on productivity growth, neither the private nor the public sector can go it alone.
