
This blog post accompanies the SDPB Monday Macro segment that airs on Monday, October 2, 2023. Click here to listen to the segment, which begins at minute 25:45. For more macroeconomic analysis, follow J. M. Santos on Twitter @NSMEdirector.
These days, seems lots of people are thinking about interest rates. Meanwhile, seems far fewer people are thinking about labor productivity; or if they are thinking about it, they are not talking about it to the extent they are talking about interest rates. Labor productivity is a measure of the average level of output—think, stuff—produced per hour of labor input. The amount of capital, like the machines and tools with which we equip labor, and the production technology, the recipes with which we combine labor and capital, determine labor productivity. Over time, increases in the amount of capital and improvements in technology grow labor productivity. The two macroeconomic measures—interest rates and productivity rates—are tightly intertwined, particularly in the context of monetary policy, in which the central bank must target an interest rate that balances aggregate demand and aggregate supply in a way that generates low and stable inflation.
As Schooled readers know well, interest rates have risen quickly in the last eighteen months. Meanwhile, labor productivity has neared its pre-pandemic growth rate. In Figure 1, I illustrate as a four-quarter moving average, quarterly labor productivity growth—the growth in the average output produced per hour.
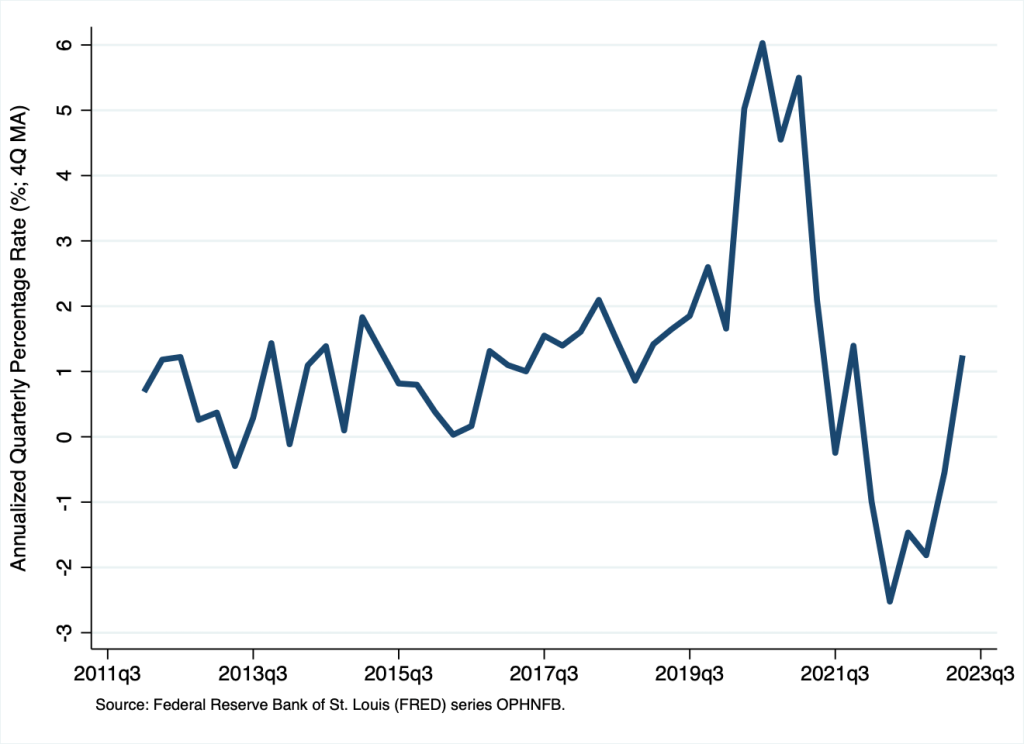
According to Figure 1, labor productivity growth rose dramatically during COVID, as output declined at a slower rate than labor hours did; then, labor productivity growth fell dramatically immediately after COVID, as labor hours returned to a relatively normal level. Since its abrupt rise and fall during and immediately after COVID, labor productivity growth has nearly returned to its pre-pandemic pattern; in the second quarter of 2023, labor productivity grew at an annual rate of 1.25 percent—not great, but better than nothing.
In the long run, labor-productivity growth is as important as low and stable inflation; in fact, the two are related. Labor productivity is fundamentally important because its growth is a principal cause of economic growth—think, growth of output per person. In Figure 2, I illustrate output per person, which I define as real GDP divided by the population, since 1990.

According to Figure 2, economic growth in the U.S. economy is typical, though business cycles—expansions and contractions in U.S. economic activity—are common. The recessions during the financial crisis in 2008 and the pandemic in 2020 are apparent in Figure 2, for example. As output per person rises, so too does the amount of goods and services available to all of us. In this way, you could think of economic growth as the growth in the average standard of living in the long run. The consequences of economic growth are profound. For example, an economy that sustains an economic growth rate of 1 percent annually would double output per person about every 70 years; whereas an economy that sustains an economic growth rate of 2 percent annually would double output per person about every 35 years. Because most individuals would prefer, all else equal, to live in an economy in which the average standard of living doubles, say, twice in a lifetime instead of once in a lifetime, understanding the principal sources of economic growth is very important. Additionally, understanding economic growth is important because high inflation is a consequence of an imbalance between aggregate demand and aggregate supply, and economic growth is reflected in changes in aggregate supply over time.
By definition, economic growth is a dynamic process, because changes in output per person occur over time. At a moment in time, output per person (γ, which I illustrate in Figure 2) is the product of labor productivity, labor hours per employee, the employment rate, and the labor-force participation rate, as follows.
γ = ρ × η × ε × λ
Where ρ is labor productivity (output per labor-input hour, the growth of which I illustrate in Figure 1), η is labor hours per employee, ε is the employment rate (employees per labor force), and λ is the labor-force participation rate (labor force per population). This decomposition must be true based on how we define γ, ρ, η, ε, and λ. By definition, then, output per person (γ) must equal the product of the four terms on the right-hand side of the expression.
If, according to the expression above, output per person (γ) is the product of labor productivity (ρ), labor hours per employee (η), the employment rate (ε), and the labor-force participation rate (λ), then arithmetic—not macroeconomics—tells us that the growth rate of output per person—our measure of economic growth—is approximately the sum of the growth rates of these terms, as follows.
growth rate of γ = growth rate of ρ + growth rate of η + growth rate of ε + growth rate of λ
So, the principal sources of economic growth—notationally, the growth rate of γ on the left-hand side of the expression—are the growth rates of labor productivity (ρ), labor hours per employee (η), the employment rate (ε), and the labor-force participation rate (λ) on the right-hand side of the expression. In Table 1, I report the average annual growth rates of γ, ρ, ε, and λ for various sample periods. (In the table, I do not report the annual growth rate of labor hours per employee [η] because it varies relatively little; for example, for the last forty years, η has measured about 1800 hours, or about 52 weeks times about 35 hours per week.)
| | γ | ρ | ε | λ |
| 1960 – 2021 | 2.0 | 2.0 | 0.0 | 0.1 |
| 1960 – 1972 | 2.8 | 2.8 | 0.0 | 0.1 |
| 1973 – 1995 | 1.9 | 1.5 | 0.0 | 0.4 |
| 1996 – 2007 | 2.2 | 2.7 | 0.1 | (0.1) |
| 2008 – 2023 | 1.2 | 1.4 | 0.1 | (0.4) |
Across each row in Table 1, the average annual growth rate of output per person (γ) equals approximately the sum of the average annual growth rates of labor productivity (ρ), the employment rate (ε), and the labor-force participation rate (λ). For example, consider the row associated with the sample period 2008 to 2023 (Q2): the average annual growth rate of output per person (γ) is a relatively low 1.2 percent, which approximately equals the average annual growth rate of labor productivity (ρ; 1.4 percent) plus the average annual growth rate of the employment rate (ε; 0.1 percent) plus the average annual growth rate of the labor-force participation rate (λ; – 0.4 percent). To be sure, because of how we empirically define and measure these terms, this additive relationship is not perfect—consider, for example, the row associated with the sample period 1996 to 2007. Nevertheless, from the perspective of a macroeconomist, the rows in Table 1 capture a strong relationship.
That productivity is the most important cause of economic growth is apparent in the table, in which the average annual growth rate of output per person (γ) and the average annual growth rate of labor productivity (ρ)—columns two and three in Table 1—align over time. For example, for the entire sample period of 1960 to 2021, each of these measures registers roughly 2.0 percent. This alignment generally occurs because, in the long run, labor-market forces reflected in, say, the rates of job search and separation determine the (natural) employment rate (ε), while demographic forces largely determine the labor-force participation rate (λ). Because labor-market and demographic forces change relatively slowly over time, these forces do not explain much of economic growth. Rather, labor-productivity growth explains nearly all economic growth.
According to Table 1, the sample period 1960 to 1972 was a high-water mark for economic growth and, thus, labor productivity; output per capita (γ) and labor productivity (ρ) each grew on average 2.8 percent annually. In contrast, the sample period 1973 to 1995 was, until recently, a low-water mark; during that period, output per capita (γ) and labor productivity (ρ) grew on average 1.9 percent and 1.5 percent annually (while the labor-force participation rate grew on average 0.4 percent annually, so that 1.9 percent equalled 1.5 percent plus 0.4 percent).
Interestingly, the sample period 2008 to 2023 (Q2) appears to be the new low-water mark for output per person (γ) and labor productivity (ρ). Over this sample period, the alarmingly low average annual economic growth rate of 1.2 percent is explained by an alarmingly low average annual productivity-growth rate of 1.4 percent—less than the rate the economy registered during the infamous productivity slowdown from 1973 to 1995—compounded by a fall of 0.4 percent in the labor-force participation rate due, in part, to COVID.
The most effective way to sustain economic growth through labor-productivity growth is to improve technology—the recipe, as it were, that transforms inputs, such as labor and capital, into outputs. Most economists reason that technological improvement is a largely endogenous process, an outcome of competitive interactions of firms maximizing shareholder value and operating in an economic environment that incentivizes activities that increase private and social returns. Not surprisingly, then, productivity is most likely to grow in an economic system of sensibly regulated market capitalism, complete with specialization and exchange (including international trade), where free enterprise and property rights are ensured. Based on this underlying theory, the U.S. Congressional Budget Office estimates potential output. In Figure 3, I illustrate real output alongside potential output, its counterfactual optimum.
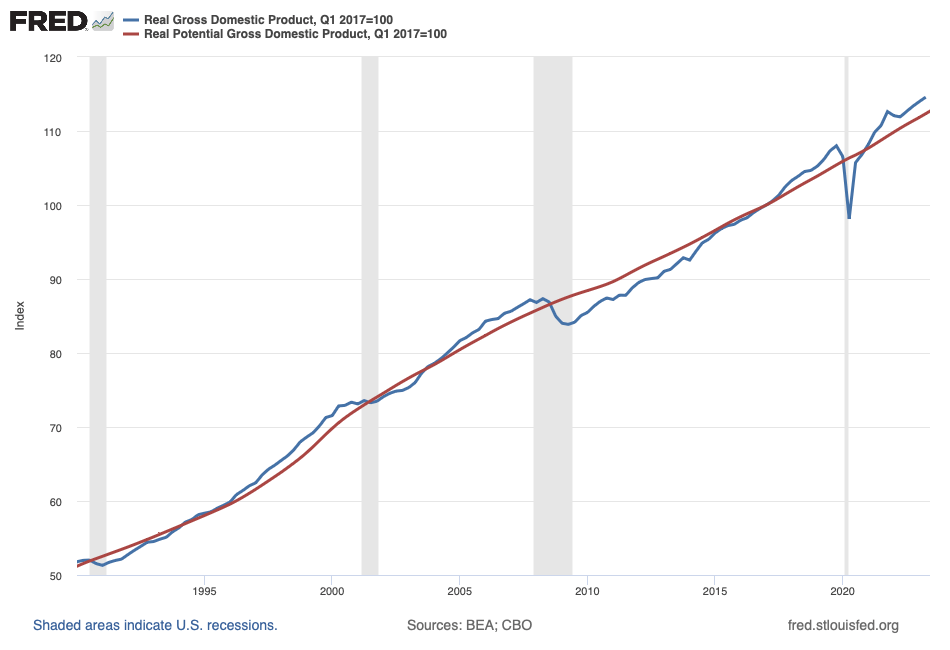
According to Figure 3, actual output (blue line) is growing above and at a faster rate than potential output (red line). And yet, according to the sample period 2008 to 2023 (Q2), output per person (γ) and labor productivity (ρ) seem to be underperforming. How to reconcile these seemingly mixed messages: actual output is above potential, and the labor productivity that causes output is underperforming or, at best, lackluster?
My takeaway is this: The forces, including labor productivity, causing output—think, aggregate supply—to grow are for whatever reasons relatively weak. Thus, aggregate supply is not a reliable source of disinflation: aggregate supply is not growing fast enough to outpace aggregate demand in a way that stabilizes the price level; the growth of output above potential we currently achieve is not consistent with low and stable inflation. Put differently, then, the interest rate that balances aggregate demand and aggregate supply in a way that generates low and stable inflation must sufficiently suppress aggregate demand, so it does not outpace aggregate supply. The interest rate consistent with low and stable inflation must be at least as high as the interest rates we observe now.
In this way, interest rates and productivity rates are tightly intertwined in the short run, particularly in the context of monetary policy. Productivity is devilishly difficult to measure, to be sure. Nevertheless, if we believe the data, the U.S. economy is not well positioned to grow its way out of high inflation; some degree aggregate demand suppression is required. Thus, all else equal, interest rates higher than the levels we have observed for over a decade, during which monetary policy and, for a time around the pandemic, fiscal policy stimulated aggregate demand, must be the new normal.
