
This blog post accompanies the SDPR Monday Macro segment that airs on Monday, December 2. Click here to listen; the segment begins at minute 8:40.
Trade is trending. Or, more precisely, grief about the U.S. trade deficit, the difference between exports and imports of goods and services, is trending, along with the usual finger pointing of whom to blame—the rest of the world, no doubt. The argument goes something like, the trade deficit exists because the rest of the world sells us their stuff on the cheap, in part because the rest of the world keeps the foreign-exchange values of their currencies weak relative to the values unfettered market forces would otherwise establish: the resulting strong U.S. dollar drives the U.S. to import goods and services, on balance. Proponents of the argument often present something like Figure 1, in which I illustrate U.S. net exports (blue line) and the foreign-exchange value of the U.S. dollar (red line): as the foreign exchange value of the U.S. dollar rises, we import more and export less, or so the story goes.
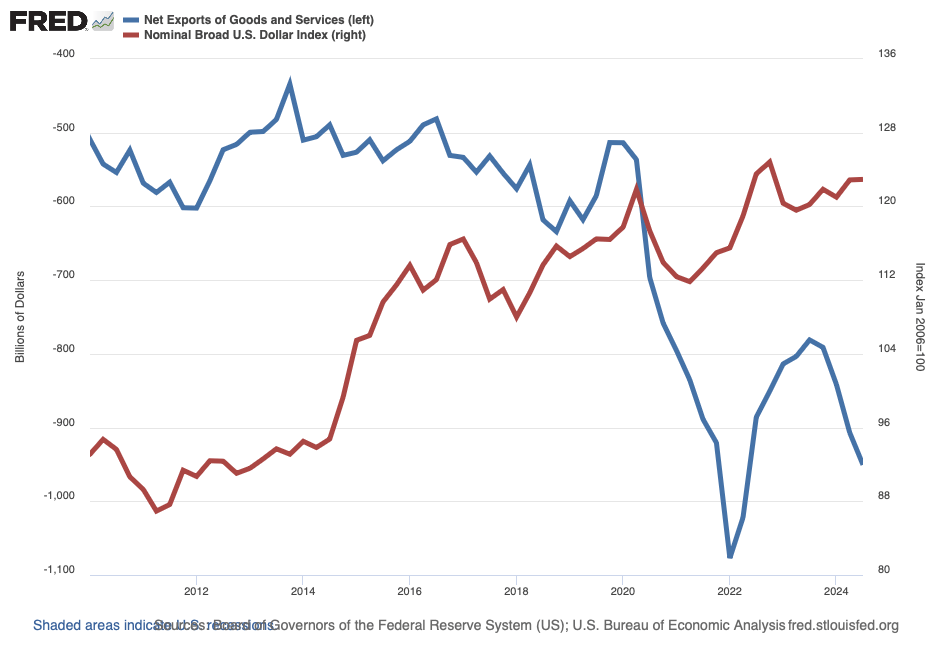
Generally speaking, Figure 1 illustrates what economists refer to as a reduced-form relationship: two variables seemingly related with no structural model to confirm the relationship: does the foreign-exchange value of the U.S. dollar drive U.S. net exports? Or do U.S. net exports drive the foreign-exchange value of the U.S. dollar? I ask you to consider the second outcome, and the possibility that a trade deficit has more to do with domestic rather than international macroeconomic forces.
Trade is a production technology that increases efficiency, effectively allowing an economy to transform inputs—the goods and services the economy produces at a comparative advantage but does not desire—into outputs—the goods and services the economy desires but does not produce at a comparative advantage. Absent trade, an economy must be self sufficient—an autarky, in the parlance of international economics. An autarky necessarily ignores the objective of productive efficiency and, along with it, (opportunity) cost minimization. All else equal, then, trade—international and otherwise—increases standards of living.
The terms of trade between nations have always been contentious. The contentiousness is occasionally warranted; not all terms of trade—including, say, the institutions that govern ownership of intellectual property—are fair. Nevertheless, more often than not, opponents of international trade object to so-called trade imbalances, a pejoratively tinged term that, as a matter of fact, simply describes an aggregate-expenditures outcome in which imports exceeds exports—think, a trade deficit. Exports measure the value of goods and services produced domestically and sold abroad; imports measure the value of goods and services produced abroad and sold domestically. Most economists do not not view trade imbalances as the work of unscrupulous trading partners. Rather, most of us view trade imbalances as the result of domestic features of a macroeconomy (and we view openness favorably).
Macroeconomists measure the degree of an economy’s openness as the sum of the economy’s exports and imports as a share of GDP. Since about the mid-twentieth century, the United States economy has grown increasingly open; the pattern is apparent in Figure 2, in which I illustrate exports and imports as shares of GDP.
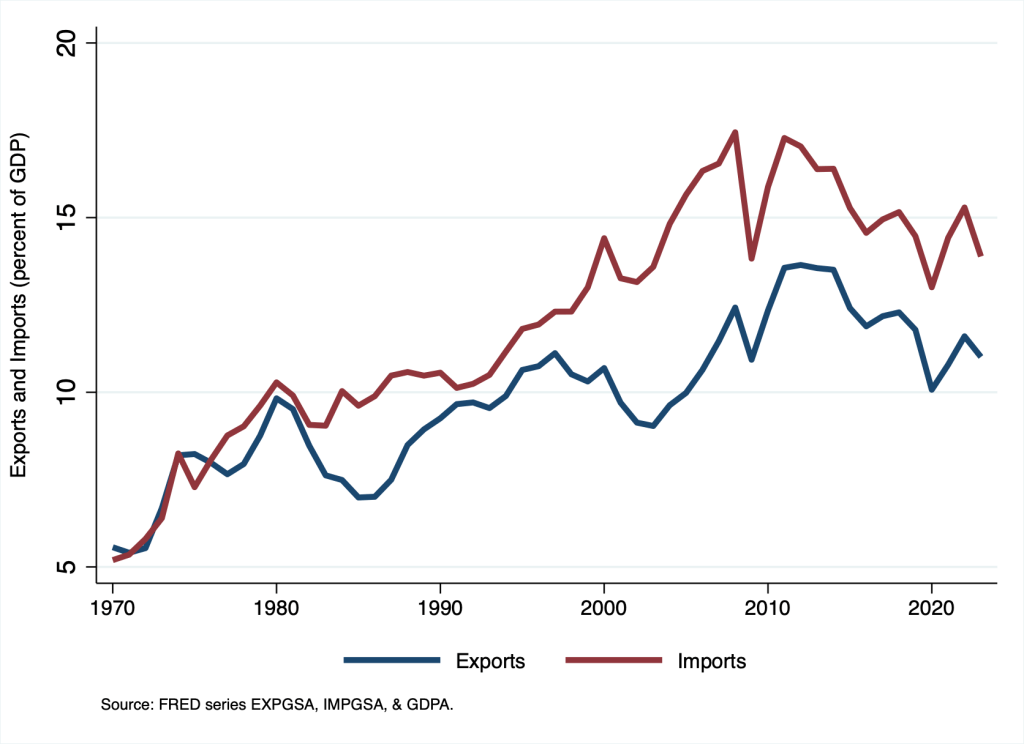
According to Figure 2, in 1970, exports and imports measured, respectively, 5.6 percent and 5.2 percent of GDP; in 2008, the shares peaked at 12.4 and 17.4; and in 2023 (the last year for which annual data are available), the shares measured 11 and 13.9 percent of GDP. Thus, measured as the sum of exports and imports, trade of goods and services between the United States and the rest of the world rose from 10.8 percent (5.6 percent plus 5.2 percent) of GDP in 1970—about the same share the United States economy recorded forty years earlier—to 24.9 percent of GDP today. Nevertheless, compared to the rest of the world, the United States remains a relatively closed economy. According to the World Bank, in 2023, the world average sum of country exports and imports as a share of same-country GDP measured 63 percent; the lowest share (of 2 percent) belonged to Sudan, and the highest share (of 394 percent) belonged to Luxembourg. The comparable 2023 shares for, say, Canada and Mexico measured 67 percent and 74 percent, respectively.
Essentially, the market values of exports and imports measure expenditures—the amounts of income households, firms, and governments spend on exports and imports. As Schooled readers and Morning Macro listeners know, macroeconomists decompose a nation’s GDP (


Often, we refer to net exports (
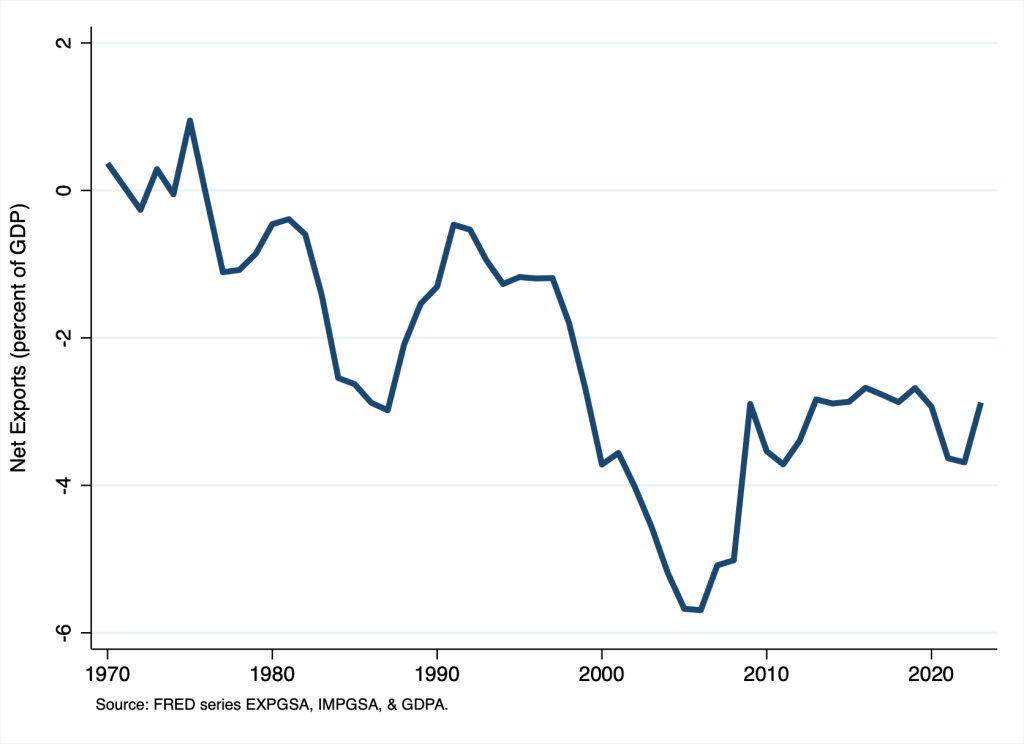
As Figure 3 makes clear, trade balances tend to be countercyclical: the balances rise during recessions and fall—think, deficits grow larger in absolute value—during expansions. For example, in 2006, as the economy expanded in the lead up to the Great Recession, the trade deficit registered -5.6 percent of GDP. Then, in 2009, as the economy reached the trough of the Great Recession, the trade deficit registered -2.74 percent. The pattern occurs because, on balance, aggregate expenditures on imported goods and services rise and fall along with domestic income. In the parlance of economics, on balance, imports are so-called normal (as opposed to inferior) goods.
Business cycles aside, the source of the trade balance is hidden (in plain sight) in the decomposition of GDP I specified above: 

The term in parentheses is national saving, which economists define as household saving, 


To understand the source of the trade deficit that the United States economy has consistently maintained since 1976, consider the expression above in the context of a trade deficit, in which case 
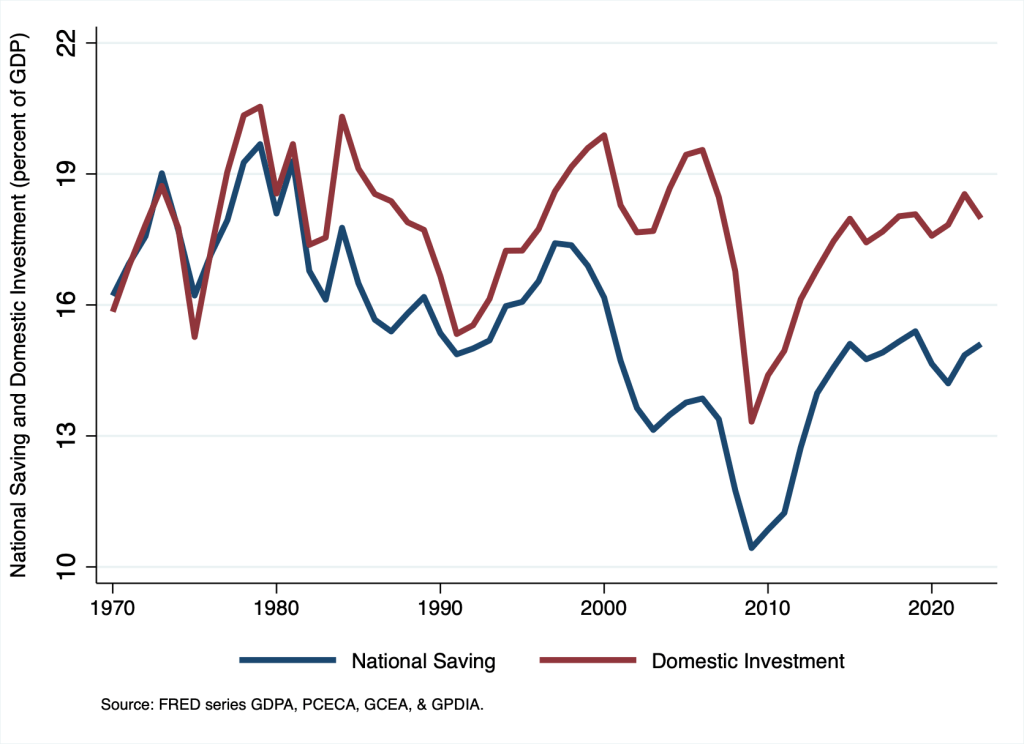
At any moment in time along the x-axis in Figure 4, net exports as a share of GDP (illustrated in Figure 3) is measured as the vertical distance of the gap between the blue and red lines. For example, according to Figure 4, in 2023, national saving as a share of GDP registered 15.1 percent; the measure is indicated by the rightmost data point on the blue line in Figure 4. Meanwhile, domestic investment as a share of GDP registered 18 percent; the measure is indicated by the rightmost data point on the red line in Figure 4. The difference between the two measures is 2.9 percent, which is the trade deficit as a share of GDP in 2023—the measure indicated by the rightmost data point illustrated in Figure 3.
So how does the United States manage to spend beyond its means—measured in terms of GDP? The short answer is the rest of the world finances the trade deficit the United States consistently maintains. Macroeconomists account for a country’s international-trade activities using a so-called balance of payments, largely consisting of a current account and a financial account. The current account includes all net income earned for all current economic activities; for simplicity, think of the current account as consisting entirely of
Put differently, in the case of a U.S. trade deficit, the international market for goods and services—think, the market for goods and services traded between the U.S. and the rest of the world—clears because the (negative) difference between national saving and domestic investment in the U.S. is matched by a positive difference between saving and investment in the rest of the world. The match—or equilibrium—occurs thanks to the foreign-exchange value of the U.S. dollar, which, in the case of a U.S. trade deficit, rises to clear the market.
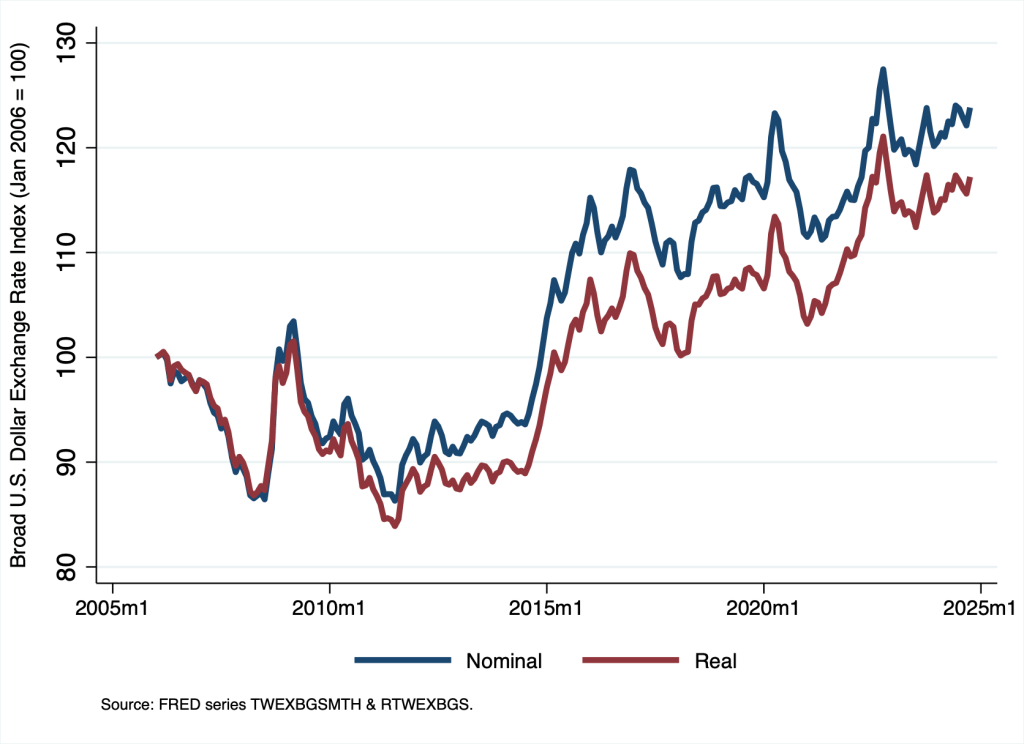
The crucial takeaway from the analysis of patterns of expenditures between the United States and the rest the world is that the trade balance is very largely determined by (domestic) national saving and domestic investment, features of a macroeconomy over which the rest of the world has relatively little, if any, control. A positive trade balance exists for the United States if national saving exceeds domestic investment and, thus, on balance, households, firms, and governments in the United States sell goods and services to the rest of the world; in this case, the foreign-exchange value of the U.S. dollar falls to clear the international market for goods and services and U.S. investors purchase foreign assets. Similarly, a negative trade balance exists for the United States if national saving falls short of domestic investment and, thus, on balance, households, firms, and governments sell goods and services to the US; in this case, the foreign-exchange value of the U.S. dollar rises to clear the international market for goods and services and investors abroad purchase assets in the United States. The pattern of a rising foreign-exchange value of the U.S. dollar amid U.S. trade deficits is visible in Figure 5, which we should view as a consequence instead of as a cause of U.S. trade deficits caused by national saving falling short of domestic investment.
The U.S. balance of trade—and, practically speaking, the U.S. trade deficit—will attract much attention in the next few years. As we debate the implications of the balance of trade, we should be mindful that domestic features of the U.S. economy are largely to blame. If, for whatever reason, we oppose trade deficits, then we must take issue with patterns of national saving and domestic investment as opposed to foreign-exchange values of the U.S. dollar and the supposed malfeasance of our international trading partners.
