
This blog post is a postscript to the Monday Macro segment, “Great (Inflation) Expectations,” which aired on Monday, May 17. (Click here to listen to the May 17 segment, which begins at minute 23:30 into the broadcast.)
The year-over-year rate of CPI inflation is not likely to trend at 2.0 percent anytime soon.
In our last blog post, “Great (Inflation) Expectations,” I mentioned that, on May 12th, the Bureau of Labor Statistics (BLS) reported the consumer price index (CPI) rose year over year—from April 2020 to April 2021—by 4.2 percent, the largest year-over-year increase since September 2008. The year-over-year rate of change in the CPI—including, for example, the 4.2 percent the BLS reported for April 2021—is a widely popular measure of the rate of inflation. Although many market observers and policymakers alike expected a relatively high year-over-year rate of inflation for April 2021, few expected a rate as high as 4.2 percent. Financial markets were not amused. At best, investors were left hoping the spike in the rate of CPI inflation was transitory. Perhaps a reassuringly low reading of the rate of inflation is just around the corner.
Or perhaps not—at least not for year-over-year CPI inflation.
The year-over-year rate of CPI inflation is not likely to settle anywhere near, say, 2.0 percent—a reassuringly low reading—anytime soon, even if macroeconomic forces slow the month-to-month rate of inflation immediately (and that’s unlikely because pandemic-induced scars in labor markets and supply chains persist while extraordinary fiscal and monetary stimulus continues to flow). The reason why rests not with macroeconomics, but rather with arithmetic and, more specifically, how we calculate a year-over-year growth rate.
Arithmetically speaking, the year-over-year measure of the rate of inflation reflects information contained in the current average price level—think, April-2021 CPI—and information contained in the year-old average price level—think, April-2020 CPI. This is because the year-over-year measure of the rate of inflation in month m in, say, year 2021 is calculated as the following, where CPIm,2021 is the level of the CPI for month m in year 2021 and CPIm,2020 is the level of the CPI for month m in year 2020.
Inflation Rate = 100 x (CPIm,2021 – CPIm,2020)/CPIm,2020
Because the average price level in April 2020—CPIm,2020 in the expression above—was extraordinarily low due to COVID-related lockdowns and so forth, all else equal, year-over-year rates of inflation for several months to come will reflect a so-called base effect—the difference between an extraordinary year-over-year inflation rate and the long-run (pre-pandemic) average inflation rate.
To understand how this arithmetic process might play out, consider Figure 1, in which I illustrate the CPI; the blue line illustrates actual data and the red line illustrates a linear, out-of-sample trend I estimate based on the monthly CPI between 2015 and 2021.
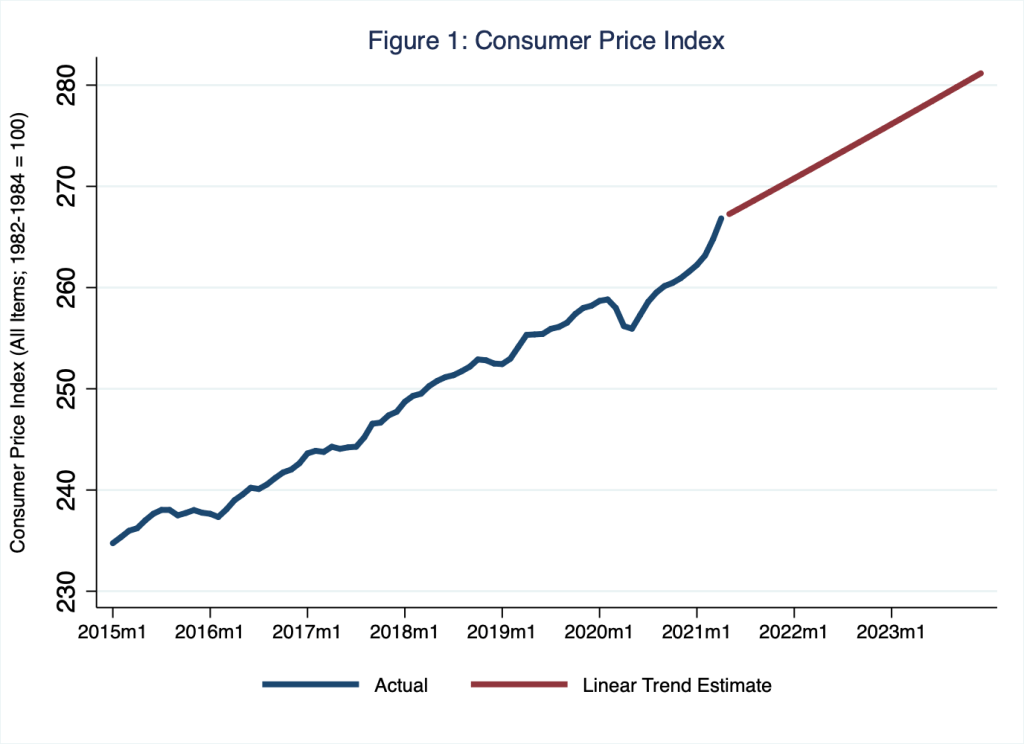
The data point on the blue line associated with April 2021 is the CPI the BLS reported on Wednesday, May 12. Meanwhile, the points on the red line shape the path the CPI would take if the rate of monthly inflation from May 2021 onward registered a pre-pandemic, month-to-month average rate of inflation of about 2.0 percent—the slope of the red line, which is based on the linear trend I estimate. Based on the data I illustrate in Figure 1, in Figure 2, I illustrate the year-over-year rate of inflation; the blue line illustrates the year-over-year rate of inflation of the actual CPI data (illustrated by the blue line in Figure 1) whereas the red line illustrates the year-over-year rate of inflation of the linear, out-of-sample trend (illustrated by the red line in Figure 1).
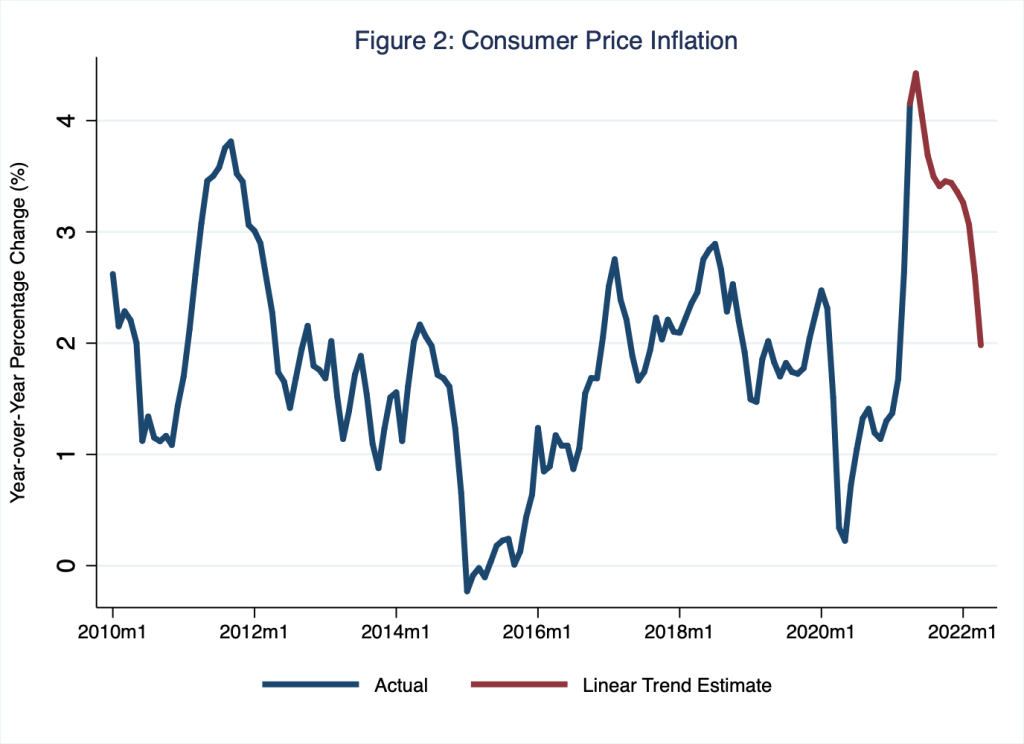
In Figure 2, the data point on the blue line associated with April 2021 is the 4.2 percent inflation rate the BLS reported on Wednesday, May 12. Intuitively, the red line in Figure 2 is an estimate of the year-over-year rate of inflation assuming the monthly rate of inflation returned immediately, once, and for all—in May 2021—to its long-run (pre-pandemic) annual average of roughly 2.0 percent. According to Figure 2, all else equal and thanks alone to base effects, the year-over-year rate of inflation would rise in May 2021 and, then, fall gradually, reaching about 2.0 percent in April 2022. Moreover, between now and then, the year-over-year rate of inflation would hover around 3.0 to 4.0 percent. In effect, this above-trend behavior of year-over-year CPI inflation is the (arithmetic) mirror image of the below-trend behavior that preceded it.
In Figure 3, I illustrate the 4.2 percent actual rate of inflation for April 2021 and the next twelve estimated-trend year-over-year rates of inflation; the latter assume the economy immediately achieves the long-run (pre-pandemic) annual average monthly rate of inflation of roughly 2.0 percent. (The inflation rates illustrated by red bars in Figure 3 are those illustrated by points on the red line in Figure 2).
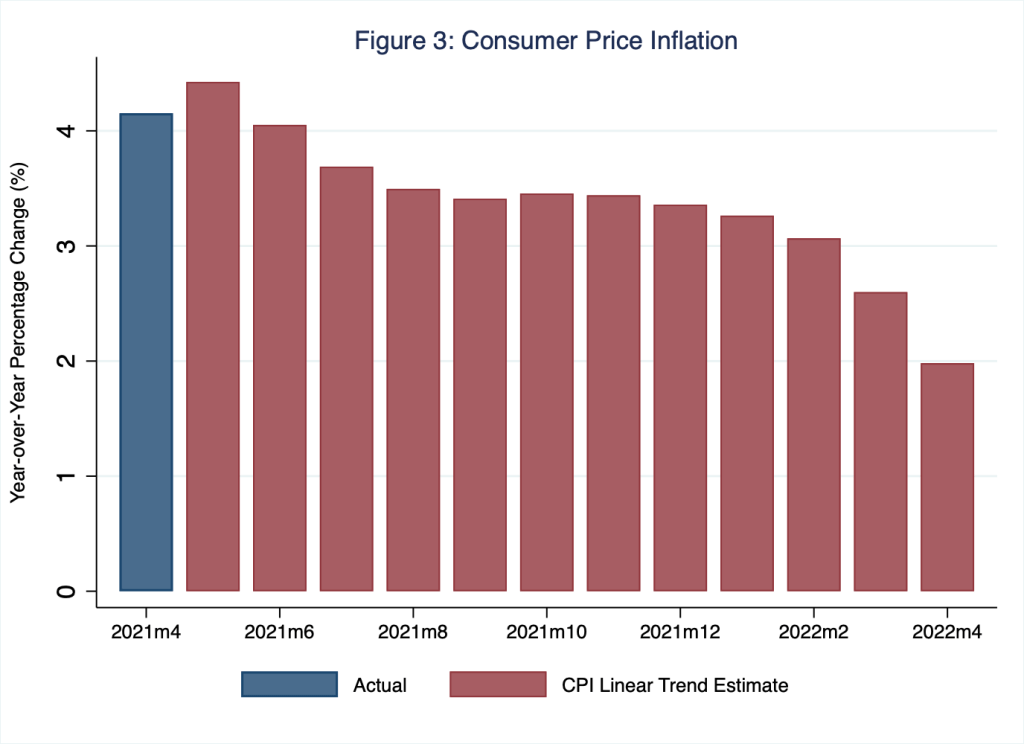
The takeaway, then, is that even if the monthly rate of inflation returned immediately to its long-run (pre-pandemic) average, year-over-year rates of inflation would nevertheless tend toward 3.0 to 4.0 percent for the next twelve months because of base effects. (Of course, because the CPI can vary irregularly between any two months, any single month-to-month rate of inflation could deviate substantially and in either direction from its trend.) Perhaps most interestingly given the consternation that the 4.2 percent rate of inflation for April 2021 caused financial markets, according to this exercise, the year-over-year rate of inflation would rise from 4.2 percent in April 2021 to 4.4 percent in May 2021 (indicated by the leftmost red bar in Figure 3) before gradually returning to 2.0 percent (indicated by the rightmost red bar in Figure 3). Thus, all else equal, barring a persistent disinflation that would slow the annualized month-to-month growth rate of the CPI to less than 2.0 percent, the year-over-year rate of inflation could not trend at 2.0 percent before April 2022.
This might be a good time not to read too much into year-over-year measures of CPI inflation.
