
This blog post accompanies the SDPB Monday Macro segment that aired on Monday, August 2, 2021. Click here to listen to the segment, which begins at minute 24:25 into the broadcast.)
In late July, I traveled to Pierre, South Dakota to participate in the South Dakota Bankers Association’s Agricultural Credit Conference. I was slated to join a panel discussion titled, “The U.S. Economy in 2021 and Beyond.” When I reached Pierre the evening before the conference began, I checked into my hotel and had a look around the place. I soon realized something was missing—at the hotel, in the adjacent restaurant, and everywhere else I roamed. What was it, I thought? And then it hit me: employees! Where are all the employees?
So I did what any self-respecting macroeconomist would do: I went in search of a Beveridge.
Let me explain.
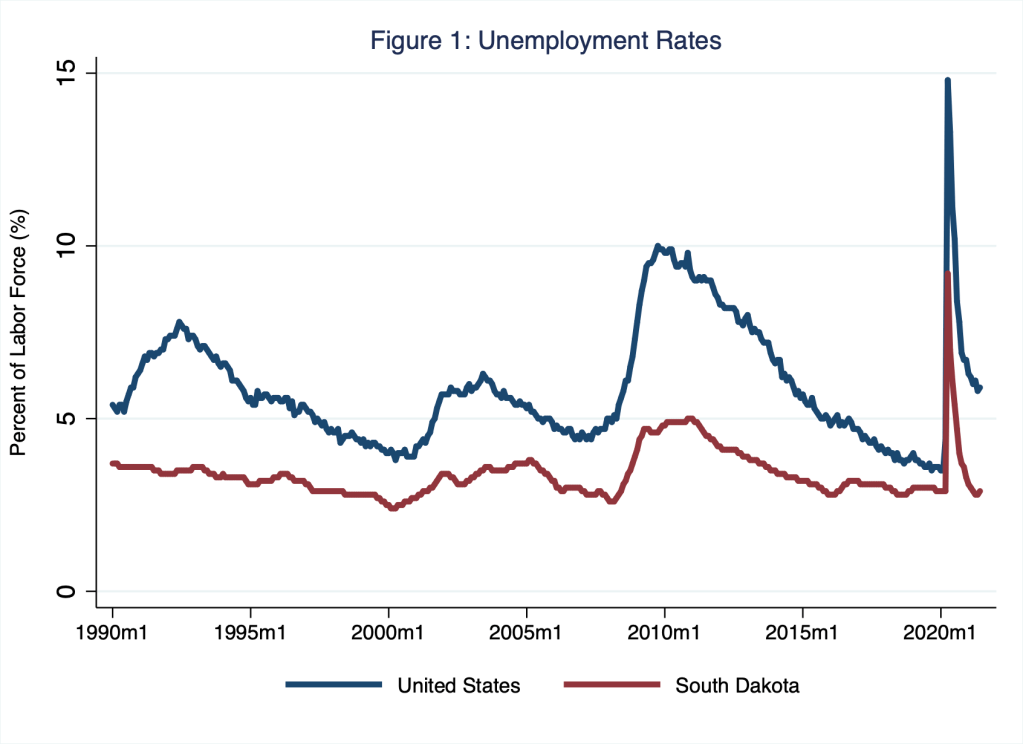
As Schooled readers and Monday Macro listeners know very well, the pandemic jolted United States labor markets. As I illustrate in Figure 1, the national unemployment rate rose suddenly in April 2020; regional unemployment rates, including the unemployment rate in South Dakota, followed a similar pattern.
Economists think about the unemployment rate as the number of unemployed persons (U) divided by the labor force (L) as follows.
Unemployment Rate = U / L
And we define the labor force as the number of employed (E) persons plus the number of unemployed (U) persons as follows.
L = E + U
For example, suppose the labor force includes 150 million persons, of whom 7.5 million are unemployed so that L = 142.5 million (E) plus 7.5 million (U). In this example, then, the unemployment rate is 5 percent, or 7.5 million persons divided by 150 million persons. (For more on how, as a practical matter, the United States Bureau of Labor Statistics defines an employed and an unemployed person, see the Monday Macro segment, “Separation Anxiety.”)
Of course, determining whether a person is unemployed or, instead, out of the labor force is difficult in practice. Employment status—employed, unemployed, or out of the labor force—can be ambiguous. For example, is the employment status of someone voluntarily out of the labor force different from the employment status of a so-called marginally attached worker, who, by definition, is not actively seeking employment but who might nevertheless be willing and able to work? The bottomline is that the unemployment rate moves over time (as in Figure 1, say) because persons move from employed (E) to unemployed (U) and because persons move in and out of the labor force.
Since April 2020, national and regional unemployment rates have somewhat recovered; though, to be sure, the national unemployment rate remains elevated relative to its pre-pandemic levels. In any case, labor markets in the United States remain scarred. For example, although the pre-pandemic United States economy had been expanding for more than a decade and labor markets were commensurately tightening (because during an expansion, the number of persons available to fill job vacancies shrinks in relation to the number of job vacancies), the labor shortage we now experience—in South Dakota certainly, but elsewhere in the United States as well—is a sign that the process of matching persons with jobs, a process that requires search, has effectively suffered a negative productivity shock of some sort.
Now, about that Beveridge.
That’s William Henry Beveridge (1879 – 1963), the British economist who wrote extensively on labor markets, the social security and welfare systems that, he argued, undergirded them, and the government’s duty to achieve full employment. To most economists, Beveridge is remembered most for his work on the relationships between job vacancies (a measure of labor demand) and unemployment (a measure of labor supply). Economists later continued this analysis in the context of a graphical relationship between unemployment rates (U) and job vacancy rates (V)—a so-called UV curve or, more commonly, a Beveridge curve, which, oddly enough, William Beveridge never illustrated or identified as such (Rodenburg 2011).
In Figure 2, I illustrate a UV (or Beveridge) curve for the United States between January 1990 and May 2021; each point in the figure represents a month (between January 1990 and May 2021) in the life of the United States labor market.
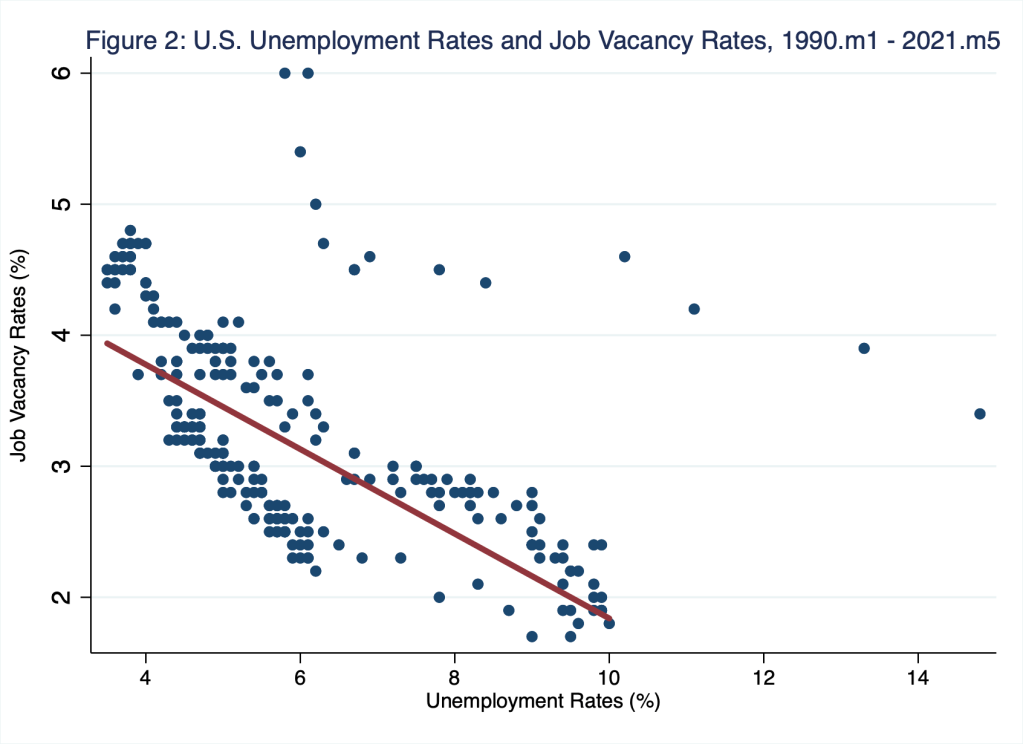
The unemployment rate on the horizontal axis and the job-vacancy rate on the vertical axis are each expressed as a percentage of the the United States labor force: thus, if, say, the unemployment rate equals the job-vacancy rate (and so the point in Figure 2 sits on an imaginary 45-degree line coming from the origin of Figure 2), the number of unemployed persons equals the number of job vacancies. Generally, points in the top left of Figure 2 represent months when the number of job vacancies exceeds the number of unemployed persons, and so labor markets are tight; and points in the bottom right of Figure 2 represent months when the number of unemployed persons exceeds the number of job vacancies, and so labor markets are loose.
The fitted line (in red) that I include in Figure 2 is based on data from January 1990 to March 2021; thus, the fitted line describes the pattern of unemployment and job-vacancy rates prior to the pandemic; and that pattern is clearly negative: as the unemployment rate falls—think, as aggregate demand and, thus, the macroeconomy expands—the job-vacancy rate rises. The closer the loci of points (and, thus, the red fitted line) are to the origin of Figure 2, the more efficient the matching process and, thus, the less effort labor-market participants must expend searching for a job. To read a Beveridge curve this way, consider, for example, a job-vacancy rate of 3 percent in Figure 2: the lower the unemployment rate associated with a job-vacancy rate of 3 percent, the more efficient the process of matching persons to jobs, and so the fewer persons left unemployed in any given month.
Since April 2020, when the national unemployment rate rose suddenly to 14.8 percent, a month represented by the far-right point in Figure 2, the Beveridge curve has effectively shifted away from the origin. This is to say, the thirteen points positioned farthest from the origin in Figure 2 represent the fourteen unemployment- and job-vacancy-rate pairs in the fourteen months from April 2020 to May 2021. (Thirteen points represent fourteen months in Figure 2 because in two months since April 2020—namely, November and December 2020—the unemployment rate and the job-vacancy rate remained unchanged at 6.7 and 4.5, respectively.) Indeed, a similar phenomenon has likely occurred in South Dakota. For example, according to the South Dakota Department of Labor and Regulation, in June 2021 about 16,000 unemployed persons were available to fill about 41,000 (online-advertised) job vacancies, bringing the number of statewide unemployed persons per job opening to about .39—an exceptionally low ratio (and, thus, a point somewhere in the top-left of a hypothetical Beveridge curve); the comparable June-2021 figure for, say, Minnehaha County was 0.25!
Search matters.
Since the pandemic began, many circumstances have conspired to increase search time and effort. The most obvious of these is the pandemic itself. Some jobseekers may have become more selective, looking to avoid the types of employment that might increase risks of exposure to COVID-19 and its variants. Meanwhile, some jobseekers may have prolonged their search in order to match more appropriately their skills and preferences to job vacancies; to be sure, economists view this sort of extended search as a potential long-term boon to job satisfaction, labor productivity, and, thus, economic activity. Still other job seekers may have found their search efforts hampered by demands at home, including caring for children and elderly relatives for example; women have been exceptionally affected during the pandemic in this regard. Of course, for some jobseekers, the extended and augmented unemployment-insurance benefits of fiscal stimulus programs have reduced the need to search—at least for now. Finally, and perhaps as importantly as any other competing explanation for the outward shift of the Beveridge curve, the United States economy is extremely dynamic. Even had a pandemic not occurred, sectoral and geographical shifts of labor demand and supply, and innovations that favor capital over labor would have occurred; the pandemic likely catalyzed these labor-market dynamics. Thus, today, search is more complicated—and, thus, matching is more difficult—in part because the economy that we recently jumpstarted is different than the one we locked down. Finally, wages motivate search. Since the pandemic began, wage pressures have risen a bit, though apparently not enough to motivate more-vigorous search and matching; this pattern will likely change: as the economy moves further up and to the left of its Beveridge curve (and so as unemployment rates fall and job-vacancy rates rise), wages will rise further, increasing incentives of the unemployed (or those outside the labor force) to gain employment.
But there is likely more to this story.
Let’s consider what the pandemic did to employment levels in the United States.
To understand more about the source of the current labor shortage around the country and, specifically, in South Dakota, consider how the pandemic affected labor markets. In Figure 3, I illustrate employment levels across industries in the United States and, for simplicity, I indicate employed persons in a given month relative to employed persons in January 2020; thus, in this figure, a vertical-axis reading of, say, .8 implies that the number of persons employed in that month equals 80 percent of the number of persons employed in January 2020.
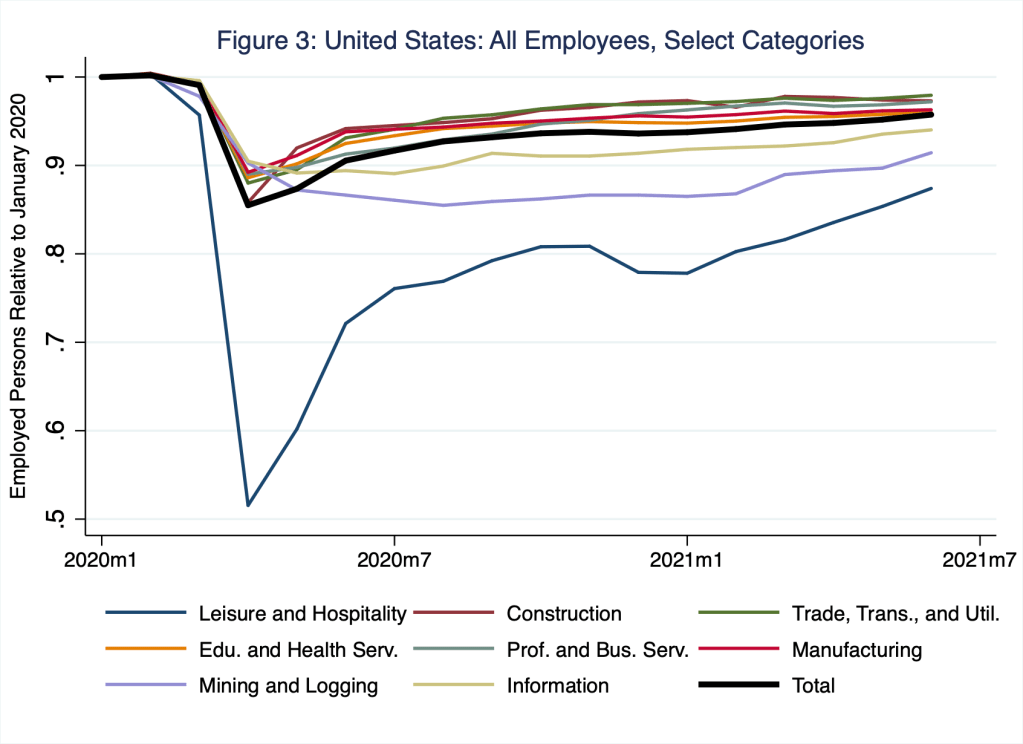
In Figure 3, I illustrate the employment paths for only those industries in which employment fell by at least 10 percent as a result of the pandemic. The leisure and hospitality industry was most affected; there, the level of employment fell suddenly by 49 percent. The level of total non-farm employment, indicated by the thick, black line in Figure 3, fell by 15 percent or 22.3 million jobs. The employment levels in these industries have yet to recover fully; the exceptions (which I do not illustrate in Figure 3) are mining and logging and financial services. In Table 1, I report for all United States non-farm industry employment categories more specific information on how the pandemic affected United States labor markets.
Table 1: United States: Employment Losses and Gaps, All Industry Categories, as of June 2021
| Employment Category | Category Loss | Contribution to Total Loss | Contribution to Total Gap | Contribution to Total Gap (#) |
| Leisure and Hospitality | 49% | 5% | 10% | 2,181 |
| Other Services | 24% | 1% | 1% | 297 |
| Construction | 15% | 1% | 1% | 238 |
| Trade, Transportation and Utilities | 12% | 2% | 3% | 598 |
| Education and Health Services | 12% | 2% | 5% | 1,028 |
| Professional and Business Services | 11% | 2% | 3% | 633 |
| Manufacturing | 11% | 1% | 2% | 481 |
| Mining and Logging | 10% | 0% | 0% | 60 |
| Information | 10% | 0% | 1% | 178 |
| Government | 4% | 1% | 4% | 995 |
| Financial Activities | 3% | 0% | 0% | 75 |
| Total | 15% | 15% | 30% | 6,764 |
In the Table-1 column labeled “Category Loss,” I report the fall in employment levels across industries; Table 1 is related to Figure 3: that is, the category losses I report in column 2 of Table 1 are represented by the troughs I illustrate for select industries in Figure 3. To understand the remainder of Table 1, consider for example the leisure and hospitality industry. That industry’s employment loss of 49 percent (column 2) contributed 5 percentage points (column 3) to the total employment loss of 15 percentage points (column 3, last row) that the United States economy experienced suddenly in April 2020. Moreover, as of June 2021, that industry remains responsible for 10 percentage points (column 4) of the 30 percentage-points gap in employment (column 4, last row) the United State economy has yet to close. Finally, for the leisure and hospitality industry, the current gap consists of 2.1 million persons (column 5, which is in thousands) who once worked in the industry but have not returned (on net). For the economy as a whole, the gap consists of 6.8 million persons (column5, last row).
The pandemic-related employment-loss patterns for South Dakota are similar, though not identical, to those of the United States economy. In Figure 4, I illustrate the employment paths for only those industries in which employment fell by at least 5 percent as a result of the pandemic.
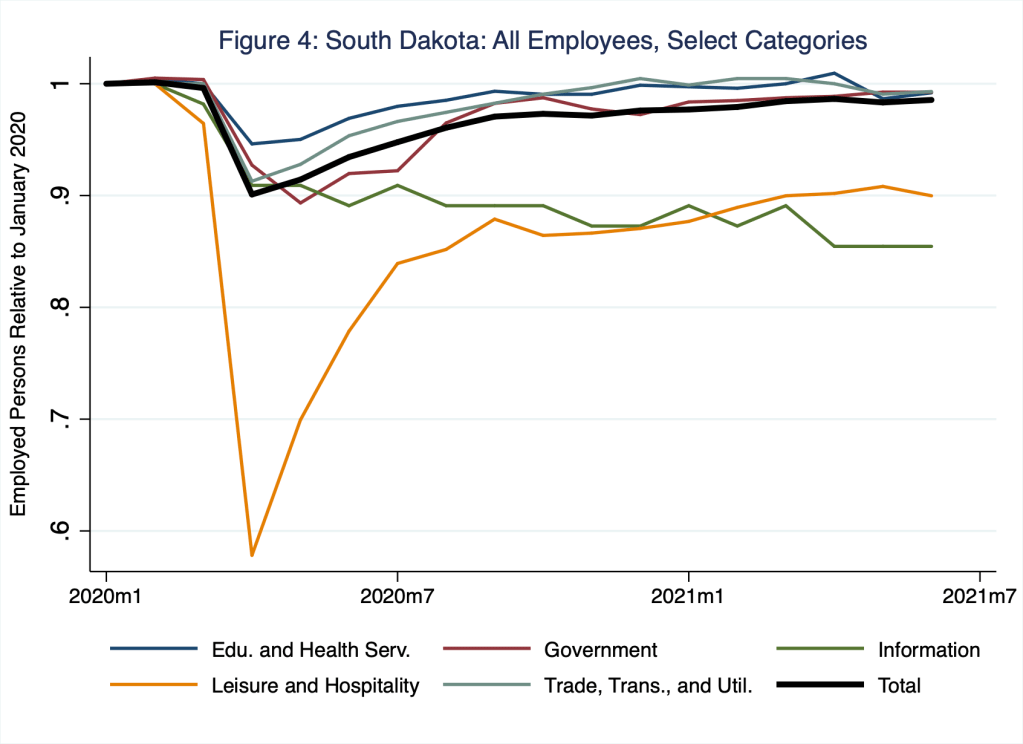
As with the national experience, in South Dakota, the leisure and hospitality industry was most affected; there, the level of employment fell suddenly by 42 percent. Meanwhile, the level of total non-farm employment in South Dakota, indicated by the thick, black line in Figure 4, fell by 10 percent or 44.4 thousand jobs. The employment levels in most industries in South Dakota have yet to recover fully; the exceptions (which I do not illustrate in Figure 4) are construction, mining and logging, and professional and business services. In Table 2, I report for all South Dakota non-farm industry employment categories, information analogous to what I report for the United States in Table 1.
Table 2: South Dakota: Employment Losses and Gaps, All Industry Categories, as of June 2021
| Employment Category | Category Loss | Contribution to Total Loss | Contribution to Total Gap | Contribution to Total Gap (#) |
| Leisure and Hospitality | 42% | 5% | 11% | 4,800 |
| Other Services | 10% | 0% | -1% | (600) |
| Information | 9% | 0% | 2% | 800 |
| Trade, Transportation and Utilities | 9% | 2% | 1% | 600 |
| Government | 8% | 1% | 2% | 1,000 |
| Education and Health Services | 6% | 1% | 2% | 900 |
| Professional and Business Services | 5% | 0% | 0% | (100) |
| Manufacturing | 4% | 0% | 1% | 400 |
| Financial Activities | 2% | 0% | 2% | 700 |
| Mining and Logging | 0% | 0% | 0% | (100) |
| Construction | -1% | 0% | -3% | (1,400) |
| Total | 10% | 10% | 16% | 7,000 |
To understand Table 2, consider once again the leisure and hospitality industry. That industry’s employment loss of 42 percent (column 2) contributed 5 percentage points (column 3) to the total employment loss of 10 percentage points (column 3, last row) that the South Dakota economy experienced suddenly in April 2020. Moreover, as of June 2021, that industry remains responsible for 11 percentage points (column 4) of the 16 percentage-points gap in employment (column 4, last row) the South Dakota economy has yet to close; put differently, the leisure and hospitality industry is responsible for about 70 percent of the current employment gap in South Dakota! Finally, for the leisure and hospitality industry, that current gap consists of 4,800 persons (column 5) who once worked in the industry but who have not returned (on net). For the South Dakota economy as a whole, the gap consists of 7,000 persons (column 5, last row).
So is everyone in the gap searching for a job or are some folks just…missing?
Actually, some folks are just missing—from the labor force, that is. The Bureau of Labor Statistics (BLS) conducts the Current Household Survey from which the BLS measures the unemployment rate and the size of the labor force for example. In the immediate aftermath of the pandemic lockdown, these data have been noisier than usual—determining whether a person is employed, unemployed, or out of the labor force is difficult in even the best of times. And the state-level results of the BLS’s Current Household Survey in the immediate aftermath of the pandemic are noisier than the national results of the survey. Thus, I begin the following investigation with a quick, back-of-the-envelope analysis of United States labor-market dynamics since the pandemic and, then, I extrapolate accordingly to understand South Dakota labor markets more clearly.
From February 2020 to April 2020, non-farm employment in the United States fell by 15 percent—think, the last row of Table 1, column 2—or about 22.3 million persons. Based on the results of the BLS’s Current Population Survey, about 70 percent—or about 15 million—of those individuals likely entered unemployment and about 30 percent—or about 7 million—of those individuals likely exited the labor force. Finally, as of June 2021, the labor force remains about 3 million individuals below its level in February 2020, a number equal to about 42 percent of the 7 million individuals who exited the labor force in April 2020; I’ll use this 42 percent in my extrapolation below for the South Dakota economy. So, of the employment gap of 6.8 million individuals I report for June 2021 in the last row of the last column of Table 1, about 3 million are likely out of the labor force; and the remainder have likely entered unemployment. (Meanwhile, the number of unemployed individuals remains about 3.8 million above its level in February 2020.)
And what about South Dakota? From February 2020 to April 2020, non-farm employment in South Dakota fell by 10 percent—think, the last row of Table 2, column 2—or about 44.4 thousand persons. Based on the results of the BLS’s Current Population Survey for the United States economy, about 70 percent—or about 30 thousand—of those individuals likely entered unemployment and about 30 percent—or about 15 thousand—of those individuals likely exited the labor force. Finally, if we assume the South Dakota labor force—a particularly noisy measure since the pandemic—remains below its February 2020 level by about 42 percent (the national estimate) of the 15 thousand individuals who exited the labor force in April 2020, most of the gap of 7 thousand individuals that I report for June 2021 in the last row of the last column of Table 2 are likely out of the labor force. (Meanwhile, the number of unemployed individuals has returned to its level in February 2020.)
Why any person leaves the labor force is often not straightforward or obvious. And while labor-force exit and entry are very common in United States labor markets, some persons who have exited the labor force since the pandemic are not likely to return. For example, the labor-force participation rate of persons aged 55 and older has fallen seemingly persistently across the United States, thanks to demography and the impetus the pandemic has offered some to retire early. Moreover, some effects of labor-market disruptions in the wake of the pandemic could be relatively long lived. Of the four most-recent recessions, only in the 2020 recession did the employment-to-population ratio—and, in this case, the labor-force participation rate—of women (and in particular, women with young children) fall more than that of men (Albanesi and Jiyeon Kim 2021). Whether these women who exited the labor force are able to re-enter it soon is not clear. Finally, the sectoral and geographical shifts of labor demand and supply, innovations that favor capital over labor, and the depreciation of human capital—job skills, networking contacts, and so forth—that may have occurred during the pandemic could raise search efforts to the point where some labor-market participants choose to exit the labor force for much longer than usual.
In any case, as the United States economy exits the pandemic and, in doing so, overcomes supply-chain challenges the pandemic has imposed, I suspect the current excessive tightness in national and local labor markets will abate—and, at the very least, return to something more like pre-pandemic levels. Barring returns to lock-downs and so forth, over the next several months, labor-market search and matching will grow more efficient (and so the Beveridge curve will shift inward), while wages will likely rise. Meanwhile, transitory forces driving some persons in South Dakota and elsewhere to remain outside the labor force will likely fade.
References
Albanesi, Stefania and Jiyeon Kim. 2021. “Effects of the COVID-19 recession on the US labor market: Occupation, family, and gender,” Journal of Economic Perspectives, 35(3): 3-24.
Rodenburg, Peter. 2011. “Transformation of the UV curve in economic theory,” European Journal of the History of Economic Thought, 18 (1): 125-153.

2 thoughts on “in search of a beveridge”