
![]() This blog post accompanies the SDPR Morning Macro segment that aired Monday, March 18.
This blog post accompanies the SDPR Morning Macro segment that aired Monday, March 18.
Last Friday, March 15, the Bureau of Labor Statistics (BLS) reported,
“Over the month [of January], hires and separations were little changed at 5.8 million and 5.6 million, respectively. Within separations, the quits rate was unchanged at 2.3 percent and the layoffs and discharges rate was little changed at 1.1 percent.”
In the dispassionate parlance of macroeconomics, job separation occurs when an employee quits, is laid off, or is discharged. At a personal level, job separation can be a traumatic and dehumanizing experience, particularly if it results from a layoff or a discharge. At a macroeconomic level, job separation is a force (among others) that raises the unemployment rate and potentially reduces our collective economic well-being, which economists measure as output per capita. Output per capita is driven by three principal components: labor productivity (the subject of a future Morning Macro segment), the unemployment rate, and the labor-force participation rate. The latter two components measure labor utilization—the extent to which the macroeconomy employs its potential supply of labor services in order to produce output. Thus, the level of labor utilization contributes positively to economic wellbeing.
Let’s begin with the unemployment rate.
The BLS, a unit of the U.S. Department of Labor, calculates the unemployment rate (along with other statistics that measure U.S. labor utilization). To do so, the BLS gathers data from monthly survey responses from the adult members of 60,000 U.S. households. The survey instrument, which is designed to determine its respondents’ employment status, is called the Current Population Survey. Essentially, the BLS identifies each respondent as either employed, unemployed, or out of the labor force. The BLS, and economists more generally, define the labor force (L) as the sum of employed (E) and unemployed (U) individuals as follows.
L = E + U
According to the BLS, an employed individual is a paid employee or an unpaid employee in a family business. The BLS counts as employed any individual who, at the time the survey is administered, is not working because she is on vacation, she is unable to get to work due to inclement weather, or she is ill. Moreover, the BLS counts as employed any part-time employee, whether or not she wishes to be employed full time. In contrast, an unemployed individual is anyone who, during the four weeks preceding the survey, was actively seeking employment or waiting to return to work due to a layoff. Of course, millions of individuals do not belong to either of these categories. This is to say, millions of individuals are neither employed nor unemployed; rather, they are out of the labor force—full-time students or retirees are the simplest examples.
Based on the definition of the labor force, the unemployment rate is, arithmetically speaking, the number of unemployed individuals divided by the labor force, as follows.
Unemployment Rate = U / L
For example, suppose the labor force includes 150 million individuals, of whom 7.5 million are unemployed. In this example, the unemployment rate is 5 percent, or 7.5 million divided by 150 million. Notice, the unemployment rate is an inherently macroeconomic statistic; it describes a general feature of the economy-wide labor market as opposed to a specific feature of the labor market for, say, automobile mechanics, primary-school teachers, or dentists.
As a practical matter, determining whether an individual is unemployed or, instead, out of the labor force is difficult; and this is a serious problem because if the BLS cannot accurately measure the labor force, then the BLS cannot accurately measure the unemployment rate. The root of the problem lies in the fact that employment status—employed, unemployed, or out of the labor force—can be ambiguous. For example, is the employment status of someone voluntarily out of the labor force different from the employment status of a so-called marginally attached worker, who, by definition, is not actively seeking employment but is willing and able to work? And what about the employment status of someone who wishes to work full time but who, for economic reasons, is working part time? Most economists, including those employed by the BLS, reason that an assessment of the labor market is incomplete without some measure of marginally attached and involuntarily part-time workers.
In Figure 1, I illustrate two measures of the U.S. unemployment rate, to which economists affectionately refer as U3 and U6.
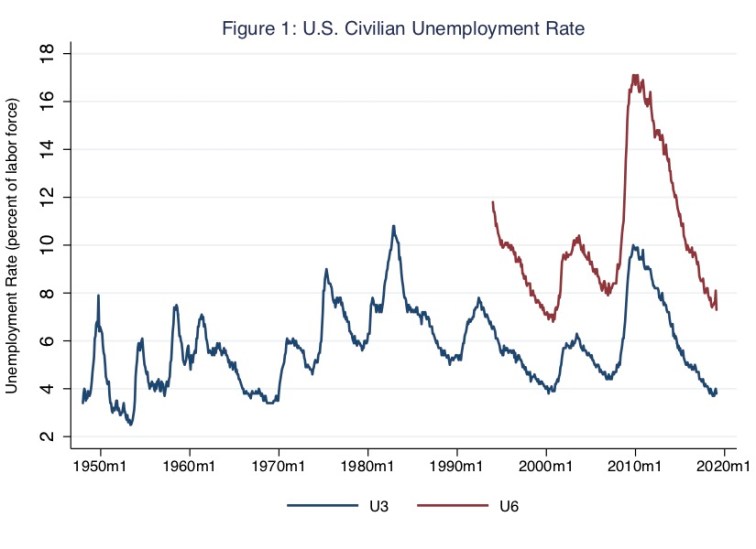
The series U3 is the standard, relatively narrow measure of the unemployment rate often cited in media coverage of the labor market. In order to calculate this measure, the BLS divides the number of unemployed individuals by the labor force: that is, the BLS computes, U/L. In contrast, the series U6 is a relatively broad measure of the unemployment rate. In order to calculate it, the BLS adds to the numerator of U/L the numbers of marginally attached and involuntarily part-time workers; and the BLS adds to the denominator of U/L the number of marginally attached workers. Thus, by construction, the U6 unemployment rate is necessarily larger than the U3 unemployment rate. For example, in the depths of the Great Recession, the U6 measure registered about 17 percent while the U3 measure registered about 10 percent. In any case, the unemployment rate is reliably countercyclical: the rate rises [falls] when the macroeconomy contracts [expands]. Thus, the unemployment rate is typically highest around a business-cycle trough and it is typically lowest around a business-cycle peak.
Currently at 3.8 percent, the (U3) unemployment rate is at a fifty-year low. Nevertheless, the unemployment rate never drops to zero; instead, the unemployment rate approaches its natural rate—the one the economy achieves in the long run, when economic output has reached it potential level. The natural rate of unemployment is greater than zero because, at any moment, some fraction of the labor force is either searching or waiting for job openings. By definition, searching for a job opening creates frictional unemployment, which economists expect in a dynamic, free-enterprise economy; types of skills and types of jobs are both heterogeneous, so matching skills to available jobs takes time and effort (and, ultimately, raises labor productivity). Whereas waiting for a job creates structural unemployment, which economists attribute to wages set above market-clearing levels (because of collective-bargaining power or market imperfections such as asymmetric information, for example). In this case, the quantity of labor supplied exceeds the quantity of labor demanded no matter how hard unemployed individuals search for job openings; for the economy as a whole, searching does not reduce structural unemployment in principle.
The natural rate of unemployment is determined by the long-run rates of job finding (f) and job separation (s), which are driven, in part, by labor-market institutions, including government policies aimed at, say, subsidizing the unemployed or mandating a minimum wage for the employed. More specifically, the unemployment rate equals its natural rate when the number of unemployed individuals (U) who find jobs at the long-run job-finding rate (f) is equal to the number of employed individuals (E) who separate from jobs at the long-run job-separation rate (s), as follows.
f × U = s × E
Substituting this long-run equilibrium equation into the unemployment-rate equation above yields the natural rate of unemployment, as follows.
Natural Rate of Unemployment = 1 / (1 + f/s)
According to this equation, the natural rate of unemployment falls [rises] as the long-run job-finding rate (f) rises [falls] and as the long-run job-separation rate (s) falls [rises]. Depending on their causes, changes in job-finding and job-separation rates can affect frictional or structural unemployment rates. For example, a job-search training program—whether publicly or privately run—raises the job-finding rate and, thus, lowers frictional unemployment; whereas a (binding) minimum or efficiency wage lowers the job-finding rate and, thus, raises structural unemployment. In Figure 2, I illustrate the natural rate of unemployment along with the actual rate of unemployment, which I measure as U3.
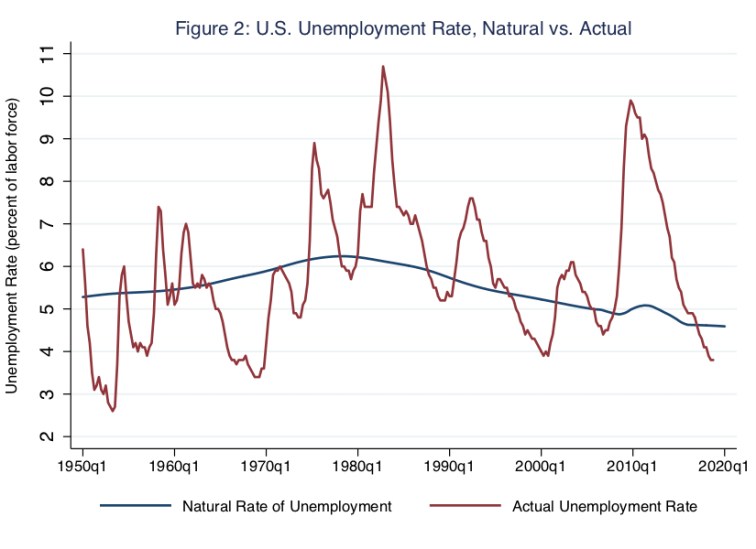
In practice, the natural rate of unemployment is an estimate, of course; in the U.S., the estimate is produced by the Congressional Budget Office. Notice in Figure 2, the natural rate is not countercyclical, because, by construction, it excludes cyclical unemployment; rather, the natural rate includes only frictional and structural unemployment. Typically, macroeconomic contractions such as, say, the Great Recession, raise the actual unemployment rate above the natural rate; economic expansions, particularly in their latter stages, create the opposite pattern. Currently, the actual unemployment rate is about 0.8 percent below the natural rate, a relationship that presumably signals a relatively tight labor market, assuming the estimate of the natural rate is reasonably accurate. For much of the post-WWII period, economists have associated a tight labor market with rising inflationary pressures—a so-called Phillips-curve tradeoff, the subject of a future Morning Macro.
In any case, Figure 3 rather starkly corroborates the notion that the U.S. labor market is tight.
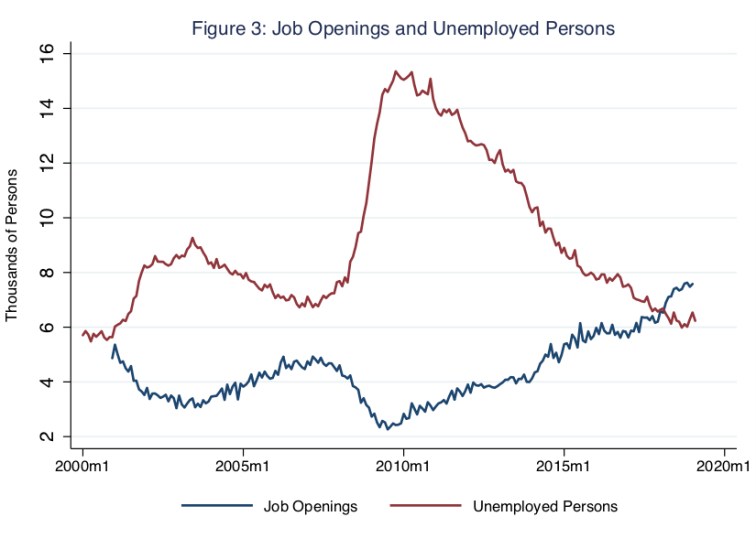
Like the unemployment rate, the number of unemployed persons is reliably countercyclical: the number rises [falls] when the macroeconomy contracts [expands]; meanwhile, the number of job openings is reliable pro cyclical. Put differently, then, the two series illustrated in Figure 3 diverge during contractions and converge during expansions. Perhaps what is most striking about Figure 3 is that, for the first time in roughly twenty years—for as long as the job-openings data have been available—the number of job openings has risen above the number of unemployed individuals, effectively raising the job-finding rate and lowering the job-separation rate above and below their respective long-run levels. This pattern is consistent with the message we take from Figure 2: currently, the actual rate of unemployment is below the natural rate of unemployment.
Nevertheless, the U.S. labor market is not entirely well.
In general, most episodes of unemployment—what economists refer to as spells of unemployment—are relatively short; most spells last only a few weeks, for example. Meanwhile, at any moment, most unemployed individuals are long-term unemployed; these individuals experience most of the time that members of the labor force spend unemployed. These statements are difficult to reconcile. Consider an example. Suppose each week—a moment in time—ten individuals are unemployed. And suppose nine of these individuals remain unemployed for the next fifty-one weeks; the tenth individual is someone new each week, because the tenth individual always finds a job within a week. In this example, over the span of one year, nine individuals are long-term unemployed and fifty-two individuals are short-term unemployed. Thus, in this example, 52/61 or 85 percent of unemployment spells are short term; whereas, at any moment in time, 9/10 or 90 percent of individuals are long-term unemployed; and these nine individuals experience 468 weeks (9 × 52) of 520 weeks (10 × 52) that 61 members of the labor force spend unemployed.
In Figure 4, I illustrate the median duration of U.S. unemployment spells.

Again, this measure, like so many other measures relating to the unemployed labor force, is countercyclical: in this case, the median number of weeks spent unemployed rises [falls] when the macroeconomy contracts [expands]. The figure rightly suggests that most unemployment spells are relatively short. The figure also illustrates that the rise in median duration around the Great Recession was unprecedented in recent history. In 2010, roughly one year after the economy exited the Great Recession, the median number of weeks spent unemployed rose to about 25, or about half a year. And although the median duration has since fallen significantly, it remains somewhat elevated relative to earlier long-lived business-cycle expansions. Not surprisingly, perhaps, the longer an individual remains separated from a job, the more difficult finding a job becomes. And, of course, the adverse consequences of being long-term unemployed reach far beyond the financial consequences, which are sufficiently troubling on their own.
Put another way, of those individuals who are unemployed, the percentage unemployed twenty-seven weeks or longer—the macroeconomic definition of long-term unemployment—is higher today than during past business-cycle expansions (when cyclical unemployment is, in principle, zero). This pattern is evident in Figure 5.
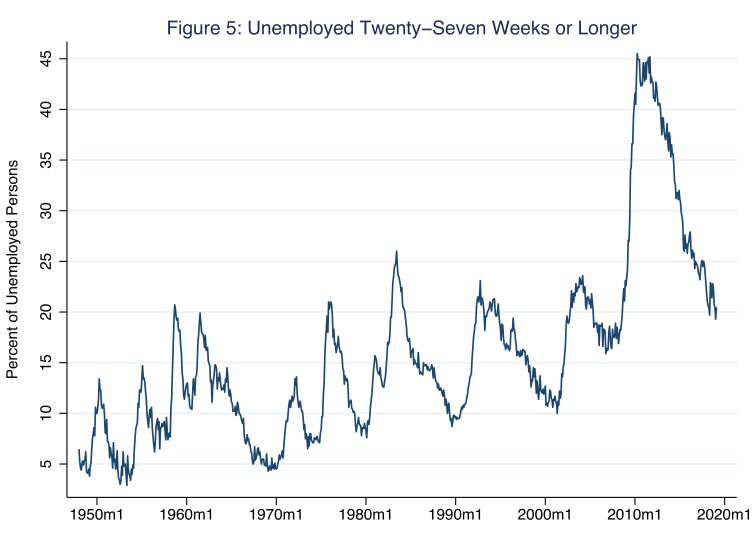
Setting aside the pronounced (and entirely unsurprising) cyclical component in this series, including the unprecedented cyclical rise in this series around the Great Recession, the percentage has increased from, say, 9 percent in the lead up to the business-cycle peak in 1990, to 10 percent in the lead up to the peak in 2001, to 16 percent in the lead up to the peak in 2007, to 20 percent today. To be clear, a rise in this percentage does not imply a rise in the unemployment rate or even a rise in the number of unemployed individuals; for example, the unemployment rate today is lower than it was near the business-cycle peak in 2001. Rather, a rise in this percentage implies a change in the composition of the unemployed labor force: on trend, the share of individuals who are long-term unemployed has increased. Thus, if we agree the unemployed labor force deserves the attention of macroeconomic policy, the policy must address the long-term unemployed—a relatively small number of individuals facing increasingly dire employment prospects.
Finally, the labor-force participation rate, which the BLS computes as the share of the adult population that participates—as either employed or unemployed—in the labor force, has fallen rather consistently from its peak of about 67 percent around the year 2000 to about 63 percent today. In Figure 6, I illustrate this pattern.
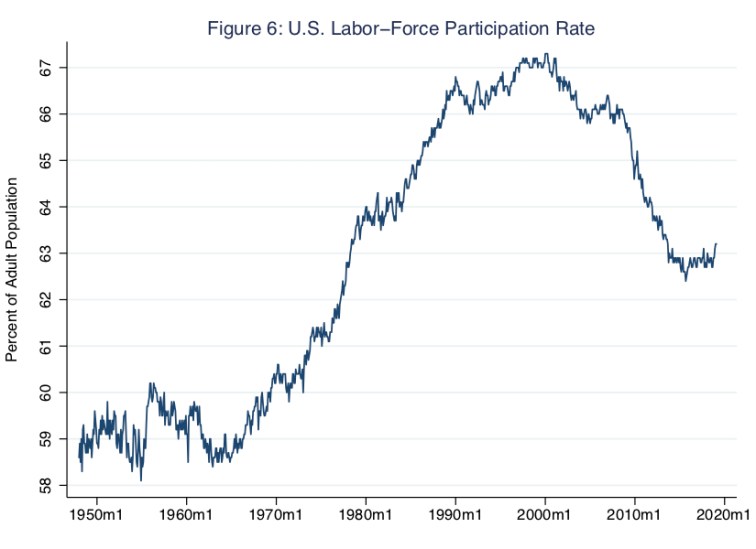
Economists attribute much—but not all—of this decline to demography: essentially, baby boomers are retiring, just as they had planned to do long before the Great Recession struck. Nevertheless, the labor-force participation rate for individuals aged 25 to 54 (the so-called prime working years), which Figure 6 does not illustrate, has also fallen, from a high of about 84 percent around the year 2000 to a low of about 82.5 percent today. This fall is more difficult to explain. Though, the explanations economists offer—for example, discouraged workers have given up hope of finding a job or, more troubling still, the opioid crisis has depleted the labor force—do not bode well for the long-term unemployed.

6 thoughts on “separation anxiety”