
![]() This blog post accompanies the SDPR Morning Macro segment that airs on Monday, April 8.
This blog post accompanies the SDPR Morning Macro segment that airs on Monday, April 8.
On Friday, the Wall Street Journal reported that the foreign-exchange value of the United States dollar neared its highest levels of 2019 because of a strong employment report released Friday by the Bureau of Labor Statistics: the economy added 196,000 jobs in March and the unemployment rate remained a historically low 3.8 percent. (For more on the labor market, see the Morning Macro segment, “Separation Anxiety.”). Meanwhile, in the same article, the Journal reported that the British pound fell 0.3 percent against the dollar because British Prime Minister Theresa May again sought to delay Brexit. Macroeconomists study and closely monitor foreign-exchange rates, which both reflect and shape the macroeconomic features of the global economy. Movements in all macroeconomic variables are difficult to explain, let alone predict; movements in foreign-exchange rates are the most difficult of all. Luckily, there’s Morning Macro.
A foreign-exchange rate—hereafter, an exchange rate—is the price of one currency in terms of another. For example, around the time this blogpost published, the price of a United States dollar in terms of the British pound was £0.77 per U.S. dollar; or, put differently, the price of a British pound in terms of the United States dollar was $1.30. Either relative price quote is correct. Throughout this blogpost, I quote the exchange rate as the foreign-currency price of the domestic currency: for example, I use £0.77 per U.S. dollar as opposed to $1.30 per British pound.
Throughout the world today, how currencies are traded and, so, how exchange rates are determined is governed by exchange-rate regimes—the institutional rules of the game set unilaterally or multilaterally by the governments of countries that engage in international financial transactions. For example, in a flexible-exchange rate regime, supply and demand for currencies determine exchange rates in the wholesale foreign-exchange market, where financial institutions buy and sell currencies—or, more precisely, bank accounts denominated in various currencies. (In contrast, tourists, for example, buy and sell foreign exchange on the retail foreign-exchange market). Currencies that trade according to a flexible regime in which demand and supply are entirely unfettered are so-called free-floating currencies, which include the British pound, the United States dollar, the euro, the Canadian dollar, and about twenty other so-called hard currencies.
Flexible exchange-rate regimes also include managed floats whereby a government occasionally purchases or sells its currency in the foreign-exchange market in order to keep the foreign-exchange value of its currency within predetermined boundaries, or bands; examples include Cambodia and the Ukraine, each of which manages the foreign-exchange value of its currency against the United States dollar. Other approaches include intermediate regimes, in which a government pegs—or, in other words, sets—the time path of the foreign-exchange value of its currency, and hard-peg regimes, in which a government essentially adopts a foreign currency. Examples of hard-peg regimes include Ecuador and Panama, each of which has adopted the United States dollar, and the European Monetary Union’s nineteen member countries, each of which has adopted the euro (which floats freely). Regime choice—that is, why a country establishes one regime over another—is quite nuanced and complicated. For a literature review, see Ghosh (2014); for a terrific political economy perspective on regime choice, see Frieden (2015).
Generally speaking, exchange rates are important (and fascinating) because they both reflect and shape patterns of international trade, the subject of a future Morning Macro. Macroeconomists account for a country’s international trade—its economic transactions with the rest of the world—using a so-called balance of payments, largely consisting of a current account and a financial account. The current account includes all net income earned for all current economic activities including, for the most part, sales of net exports of goods and services. The financial account includes all net purchases of foreign assets including bank accounts, bonds, stocks, and fixed capital—think, for example, Ford Motor Company purchases an automobile plant in Mexico. In principle, a country’s current and financial accounts sum to the same amount, because the two accounts reflect one another. Thus, in principle, the difference between the two accounts—the balance of payments—is zero. Broadly speaking, then, at any moment, the balance of payments determines the demand and supply for a country’s currency and, thus, its exchange rate.
In Figure 1, I illustrate the British-pound and euro prices of the United States dollar; the euro was established only in the late 1990s, so its (red) line begins then.

Because Figure 1 defines the exchange rate as the foreign-currency price of the United States dollar, a rise in either line indicates an appreciation of the dollar relative to the corresponding foreign currency; similarly, a fall in either line indicates a depreciation of the dollar. For example, between 1980 and 1985, the dollar appreciated against the pound: according to the blue line in Figure 1, the pound-dollar exchange rate rose from about £0.41 per U.S. dollar in 1980 to about £0.91 per U.S. dollar in 1985. Meanwhile, the dollar depreciated against the euro shortly after its inception in 1999: according to the red line in Figure 1, the euro-dollar exchange rate peaked at about €1.17 per U.S. dollar in 2001. In any case, Figure 1 (like most figures illustrating the time paths of exchange rates) illustrates nominal exchange rates, which, by definition, measure the relative prices of monetary units—pounds per dollar, for example. Nominal exchange rates do not account for changes in the average price levels in the countries in question, so we do not know if the appreciations and depreciations illustrated in Figure 1 reflect changes in a currency’s purchasing power in one country versus another.
Holding average price levels across the world constant, a dollar appreciation raises the international price of exports from the United States and lowers the international price of imports to the United States. This is to say, in general, exchange rates represent the so-called terms of trade throughout the world. Exchange rates are the international (relative) prices that correspond to the balance of trade—–the net value of goods-and-services exports and imports—of every country in the world. Thus, although exchange rates do not ultimately determine trade balances—in the long run, the process actually works the other way around—everyone identifies exchange rates with the balance of trade, a reality reflected in popular measures of exchange rates that emphasize trade. For example, in Figure 2, I illustrate two such trade-weighted measures: nominal and real indices of the foreign-exchange value of the United States dollar based on the currencies of countries with whom the United States primarily trades; the real index incorporates average price levels (and, thus, the dollar’s international purchasing power).
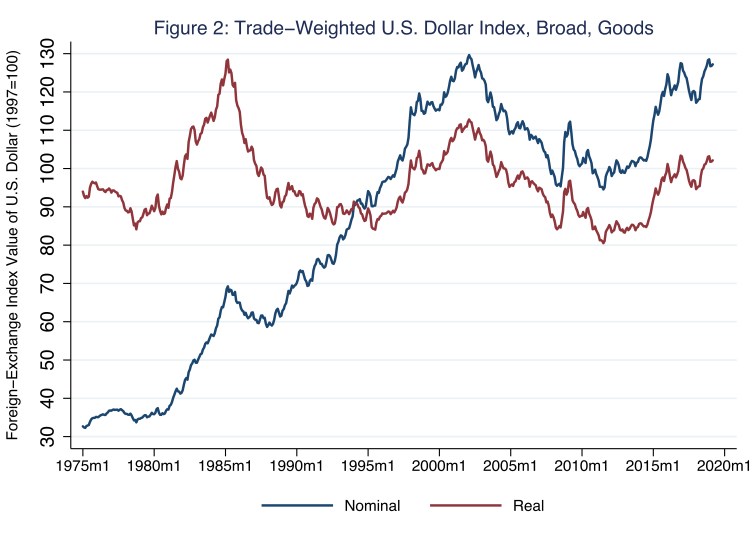
According to Figure 2, the foreign-exchange value of the United States dollar has varied substantially since the mid 1970s. The nominal measure, illustrated by the blue line, indicates that the foreign-exchange value of the dollar rose substantially until the early 2000s; thereafter, it leveled off. Meanwhile, the real measure, illustrated by the red line, indicates that the purchasing power of the dollar has been largely mean reverting, though quite volatile. For example, between 1980 and 1985, the dollar appreciated in real terms by an astounding 45 percent: according to the red line in Figure 2, the trade-weighted dollar index rose from about 88 to 128. This real appreciation was, for the most part, a consequence of relatively tight Federal Reserve monetary policy that sought to tame the Great Inflation of the 1970s and early 1980s. (For more on the Great Inflation, see the Morning Macro segment, “Follow the Yellow Brick Road.”). Since the early 2000s, the nominal and real trade-weighted measures of the foreign-exchange value of the dollar have largely converged. Christian Zimmerman, Assistant Vice President of Research Information Services at the St. Louis Federal Reserve Bank, attributes this convergence to “the convergence of inflation rates across major economies after the creation of the euro.”
Exchange rates are devilishly difficult to predict. In general, how macroeconomists model and, thus, explain exchange-rate movements over time depends on the length of time we are studying. To explain exchange-rate movements over the long run—over the span of several years, for example—economists draw on the theory of purchasing-power parity. The theory rests on the strong but instructive assumptions that goods and services produced in each country are identical and trade freely between countries. The principal implication of these assumptions is that, in the long run, nominal exchange rate movements between any two currencies are governed by the average price levels in the countries that use the currencies. For example, over the long run, the nominal exchange rate between the British pound and the United States dollar converges to the ratio of the average price levels of goods and services in Britain and the United States. In Figure 3, I once again illustrate the pound-dollar nominal exchange rate (in blue), this time along with the ratio of average price levels in Britain and the United States (in red).
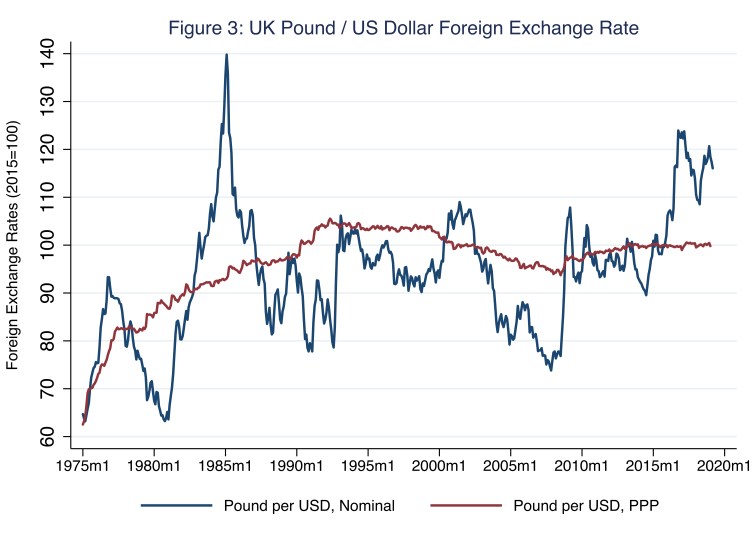
In Figure 3, the pattern that the theory of purchasing-power parity implies is evident. This is to say, over the relatively long span of four and a half decades, the nominal exchange rate reverts periodically to the ratio of average price levels. To understand why, consider the early 2000s, when the dollar appreciated relative to the pound; this appreciation was real, as well as nominal, because the nominal exchange rate (indicated by the blue line in Figure 3) exceeded the ratio of average price levels (indicated by the red line in Figure 3), so the purchasing power of the dollar exceeded the purchasing power of the pound. In the parlance of international macroeconomics, in the early 2000s, the dollar was overvalued against the pound. These terms of trade incentivized Americans and the British to purchase British goods and services, eventually increasing the value of the pound and, in doing so, eventually moving the nominal exchange rate back toward the ratio of average price levels, (re)establishing purchasing power parity. Indeed, the theory of purchasing power parity underlies the longstanding Big-Mac Index—based on an internationally homogenous good—that the The Economist magazine introduced in 1986 as a (lighthearted) measure of exchange-rate purchasing-power parity.
Finally, to explain exchange-rate movements over the short run—over the span of a few days or weeks, for example—economists draw on the theory of interest-rate parity. The theory rests on the strong but instructive assumptions that country-specific risks assumed by investors—think, savers who buy financial assets in different countries—are the same across countries, and financial capital flows freely around the world (so investors can freely enter and exit any financial market). The principal implication of these assumptions is that, in the short run, nominal exchange rate movements between any two currencies are governed by the returns available in the two countries and the expected (short-term) movement of the exchange rate. For example, suppose interest rates in the United States and Britain are both 6 percent, and suppose investors do not expect the pound-dollar exchange rate to change anytime soon; thus, at the moment, there is interest-rate parity. Now, suppose the interest rate in Britain falls to 4 percent. In this case, the pound must depreciate against the dollar, creating an expected pound appreciation that compensates investors in the pound for the lower interest rate on pound denominated assets. Thus, all else equal, differences in interest rates govern short-term movements in exchange rates.
In Figure 4, I yet again illustrate the pound-dollar nominal exchange rate (in blue), this time along with the difference in interest rates in the two countries (in red).
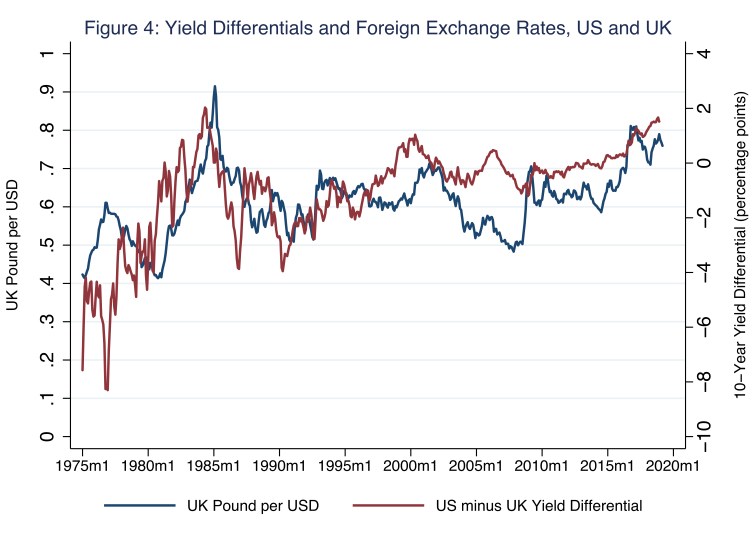
In Figure 4, the pattern that the theory of interest-rate parity implies is evident. This is to say, the nominal exchange rate is positively correlated with the difference in interest rates in the two countries. A textbook example of the interest-rate parity condition occurred during the early 1980s, when the dollar appreciated relative to the pound by about 50 percent in nominal terms. As the Federal Reserve allowed interest rates to rise dramatically, the pound had to depreciate dramatically—and, thus, the dollar had to appreciate dramatically—so that the pound’s expected appreciation compensated investors in the pound for the relatively large difference in interest rates in the two countries. Finally, the theories of purchasing-power parity and interest-rate parity are related through the expectations that govern interest-rate parity. That is, (short-term) interest-rate parity relies on the market’s collective expectation of exchange-rate movements, which are, in turn, informed by (long-run) purchasing-power parity.
No wonder exchange-rate movements are the most difficult of all to explain.
References
Frieden, Jeffry. 2015. Currency Politics: The Political Economy of Exchange Rate Policy. Princeton: Princeton University Press
Ghosh, Amit. 2014. “A Comparison of Exchange Rate Regime Choice in Emerging Markets with Advanced and Low Income Nations for 1999–2011,” International Review of Economics and Finance, 33, 358–370
Additional References
Bénassy-Quéré, Agnès, Benoît Cœuré, Pierre Jacquet, and Jean Pisani-Ferry. 2019. Economic Policy: Theory and Practice. Oxford: Oxford University Press

2 thoughts on “a tale of two currencies”