
![]() This blog post accompanies the SDPR Morning Macro segment that airs on Monday, April 15.
This blog post accompanies the SDPR Morning Macro segment that airs on Monday, April 15.
Tax day, what better day to discuss tax policy?
In principle, the objectives of tax policy include, for example, high standards of living, full employment, strong and robust economic growth and innovation, low rates of poverty, and strong environmental stewardship. Setting tax policy objectives is difficult, in part because these objectives may conflict sooner or later, particularly if the policymaker has fewer instruments—think, tax-policy tools—than objectives; thus, setting policy objectives often imposes difficult trade-offs. And that’s the good news. In reality, tax policy is neither designed nor implemented in an economic vacuum. Economic policymaking is an imperfect, complex, and dynamic path-dependent and path-shaping political process; the policy regime, as it were, matters. Nevertheless, policy regimes are shaped, if only in part, by economics, including the theory of optimal taxation.
Tax policy generally serves three functions: namely, stabilization, allocation, and redistribution. Stabilization refers to maintaining production, measured by real GDP for example, around its potential or so-called full-employment level. Tax policy that serves the stabilization function is typically characterized as fiscal policy, which technically includes discretionary taxing and government spending intended to change cyclical features of the macroeconomy, such as relatively high unemployment during a business-cycle recession. Fiscal policy was the subject of “Fiscal Therapy,” our inaugural Morning Macro segment. The substance of today’s post is optimal taxation, an area of macroeconomic theory that seeks to design tax policy that simultaneously serves—and necessarily balances—allocation and redistribution functions.
Allocation refers to assigning the factors of production—namely, labor, human capital, physical capital, and land—and technologies to their best uses, those that maximize potential economic output. Put differently, then, the allocation function, whether directed by government or the market, drives economic production and, thus, growth in the long run. Allocative tax policies intentionally create incentives, often unleashing market forces toward productive activities—those for which private and social returns align—including saving, working, and innovating, for example. A tax policy that reduces or eliminates a tax on interest income earned on savings is an example of a tax policy that serves the allocation function, because the tax cut increases the incentive to save and, thereby, increases the supply of savings. Allocative policies may also provide public goods—socially beneficial production lacking market incentives—including transportation infrastructure, public safety, public education, and environmental stewardship, for example.
Redistribution refers to reassigning income or wealth between, say, individuals and households. Put differently, then, the redistribution function reassigns rights to income earned from current production or wealth accumulated from past income. Thus, redistributive tax policies necessarily alter the distributions of income and wealth, presumably leaving them more equitable. A tax policy that progressively taxes personal income and transfers the receipts to relatively low-income earners is an example of a tax policy that serves the redistribution function. Importantly, because redistributive tax policies essentially transfer income—think, market-determined compensation to the providers of the factors of production—these policies may unintentionally reduce incentives to deploy resources to productive economic activities. Negotiating the tension between allocation and redistribution is fundamental to designing optimal taxation. To understand this tension more fully, consider the principal features of a tax that preserves allocative efficiency.
In theory, if market outcomes are socially optimal, then taxes that distort relative prices impose a cost on society, a social loss induced by an allocative inefficiency. (Consider, for example, how a labor-income tax distorts the relative price of leisure and, thus, the compensation for working.) This is because individuals make decisions based on marginal costs and benefits; taxes distort these costs and benefits, effectively leading individuals to avoid the taxes—work less in response to a labor-income tax, for example. And, in practice, nearly all taxes distort relative prices. The exception is the extremely rare—and functionally irrelevant—lump-sum tax; we cannot avoid it, so it does not affect the optimal allocation of resources. Thus, in order to preserve allocative efficiency while implementing tax policies that necessarily distort relative prices, optimal tax theory instructs policymakers to follow the so-called Ramsey rule: tax immobile—or, in the parlance of tax theory, relatively price-inelastic—tax bases. In other words, tax necessities—for example, tax food prices and, in most cases, labor income.
Clearly, the Ramsey rule is unlikely to achieve equity. For example, taxes on necessities fall disproportionately on the poor; relatively low-paid labor is the least mobile. Nevertheless, redistributive tax policies may unintentionally reduce incentives to deploy the factors of production, which earn the income and accumulate the wealth that redistributive taxes target. The term optimal taxation refers to a tax policy that is, if only in theory, efficient (because it allows the market to allocate resources efficiently) and equitable (because it redistributes resources equitably). Analyzing tax policies in the United States through the lens of this efficiency-equity trade-off is instructive. Though, of course, political-economic forces driven by special interests shape tax policy as well. Finally, the exception to this trade-off framework is corrective taxation, which seeks to deter socially burdensome production including negative externalities—cigarette sales to minors or pollution, for example.
Systematic and comprehensive taxation in the United States is a twentieth-century policy innovation. In Figure 1, I illustrate current tax receipts at the federal, state, and local levels, all of which are relatively trivial prior to the Second World War. Before the 1913 ratification of the Sixteenth Amendment to the Constitution, which established the income tax, receipts consisted primarily of tariffs and excise duties, the sum of which comprised a relatively small share of the macroeconomy of the United States. For an entertaining political history of the income tax, including its pre-1913 incarnations, see Weisman (2002).
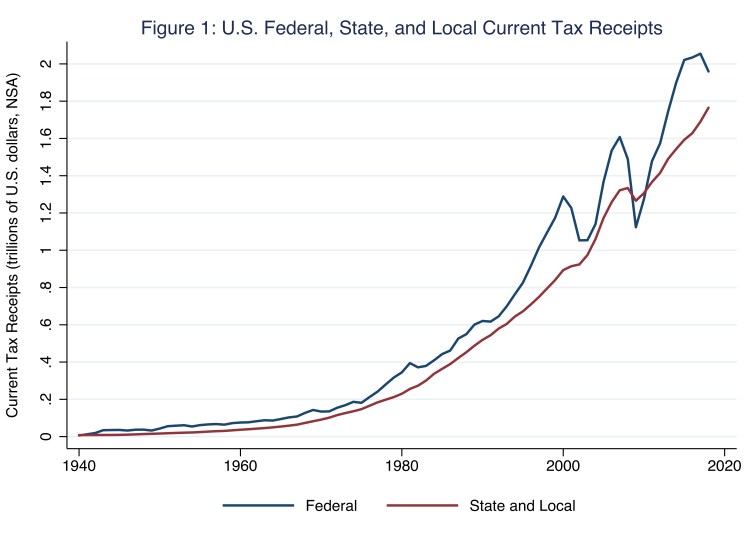
Federal receipts are pro cyclical—they rise and fall with the business cycle—at times because the federal government reduces taxes to stimulate spending during recessions, for example. Declines in federal receipts are apparent during the recessions that began in January 1980, July 1981, July 1990, March 2001, and December 2007. In contrast, only traces of pro cyclicality are apparent in the time path of state and local receipts—during the Great Recession, say. In any case, the declines illustrated by the red line in Figure 1 are strictly consequences of, as opposed to state- and local-government responses to, recessions. That is, as a practical matter, stabilization policy is the domain of the federal government, only. State and local governments do not tax or spend to change cyclical features of the macroeconomy, which, by definition, is beyond the reach of state and local tax-policy instruments. Finally, Figure 1 reveals that the federal government does not have a monopoly on taxation. For example, in 2018, federal current tax receipts amounted to roughly $2 trillion, whereas state and local current tax receipts amounted to roughly $1.8 trillion. In Figure 2, I illustrate the sum of federal, state, and local current tax receipts—the combined vertical distances below the blue and red lines in Figure 1—as a share of gross domestic product.
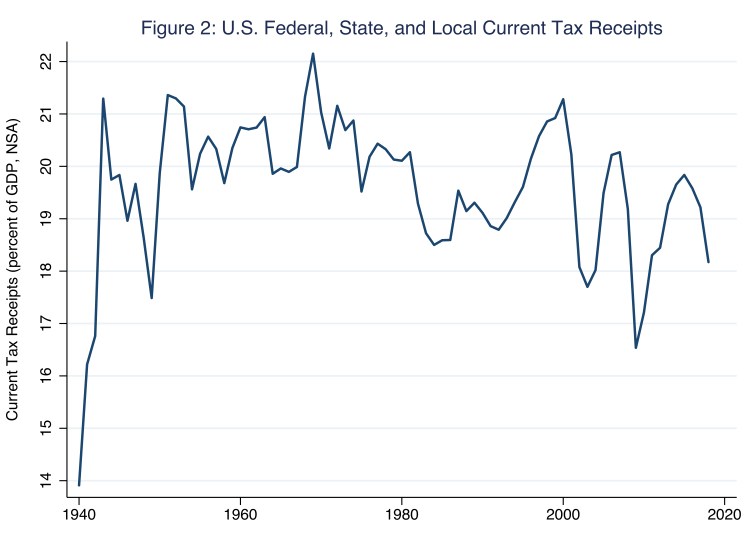
According to Figure 2, since the Second World War and during periods of more-or-less full employment, current tax receipts as a share of gross domestic product have varied between roughly 18 and 21 percent. Moreover, as in Figure 1, the pro-cyclical nature of (federal) tax receipts, which rise and fall disproportionately more than GDP (and, thus, the share of receipts rises and falls with GDP), is apparent in Figure 2. The roughly 5 percent fall in federal current tax receipts produced by the Tax Cuts and Jobs Act of 2017, which had its initial effect on 2018 receipts, is also apparent. Christian Zimmerman, Assistant Vice President of Research Information Services at the St. Louis Federal Reserve Bank, attributes this fall in federal current tax receipts to a 35 percent fall in corporate-tax income offset by a 16 percent rise in production- and import-tax income. In any case, federal receipts consist of more than tax receipts, which include receipts from current personal taxes, corporate-income taxes, production and import taxes, and taxes from the rest of the world. The single largest difference between current receipts and current tax receipts are contributions for government social insurance. In Figure 3, I illustrate the difference between the time paths of these two federal-receipt types as a share of GDP.
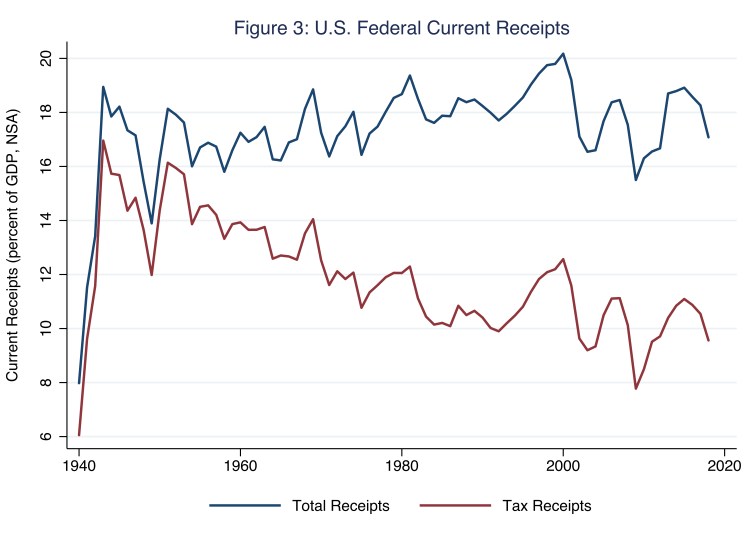
The blue line in Figure 3 illustrates total receipts as a share of GDP, whereas the red line illustrates tax receipts as a share of GDP. The former has remained relatively constant at roughly 18 percent of GDP, whereas the latter has fallen from roughly 16 percent of GDP immediately after the Second World War to roughly 10 percent of GDP today. The widening gap between the two shares has been driven almost entirely by contributions for government social insurance (and the absence of a political appetite to increase federal current receipts as a share of GDP). This pattern is apparent in Figure 4, in which I illustrate personal tax, corporate-income tax, and social-insurance contributions, each as a share of total federal current receipts, as opposed to GDP.
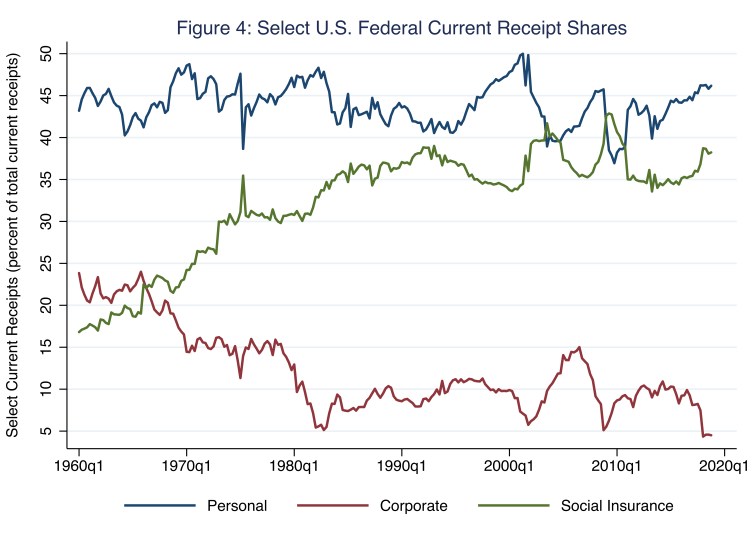
According to Figure 4, since at least the 1960s, current personal-tax receipts have remained around 40 to 50 percent of total current receipts, while current corporate-income-tax receipts have mostly fallen; incidentally, the sharp drop around the end of this time series is the result of the 35 percent fall in corporate-income-tax receipts that Christian Zimmerman of the St. Louis Federal Reserve Bank attributes to the Tax Cuts and Jobs Act of 2017. As of the second quarter of 2018, personal and corporate shares of federal tax receipts (which Figure 4 does not illustrate) were 83 and 8 percent respectively. Meanwhile, social-insurance contributions have risen as a share of total federal current receipts, driven largely by Social Security and Medicare payroll taxes that rose through the 1970s and 1980s in order to finance the retirement and health security of an aging population.
Nevertheless, although personal tax receipts comprise the vast majority of all federal tax receipts, the theory of optimal taxation has very clearly shaped how we think about and, thus, tax personal income. In Figure 5, I illustrate the highest and lowest federal marginal individual-income tax rates over the last several decades.
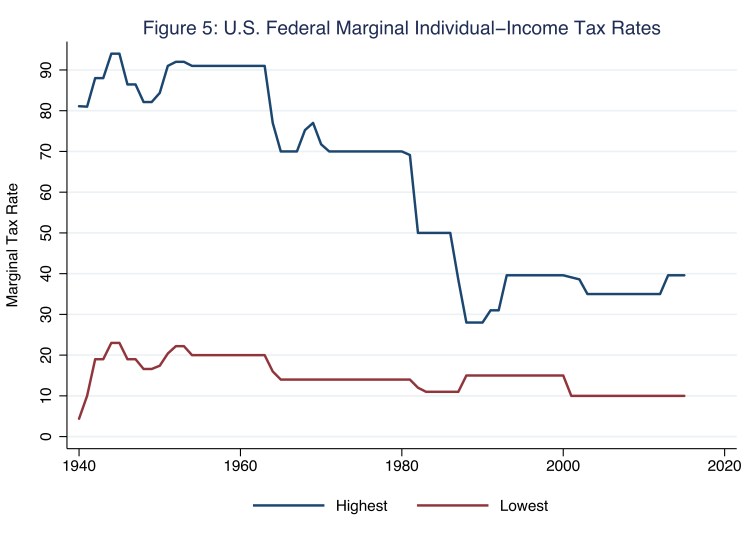
The time path of the highest marginal individual-income tax rate is perhaps most notable. Until the early 1960s, the highest marginal tax rate reached over 90 percent; today, the highest marginal tax rate is less than 40 percent. (The data in Figure 5 do not reflect the 37 percent maximum rate that the Tax Cuts and Jobs Act of 2017 established.). No doubt, this pattern of falling maximum marginal tax rates reflects, in part, political-economic compromise among special interests, the majority of which presumably wish to (tax) shelter relatively high levels of personal income, of course. Nevertheless, it also reflects, for better or worse, a prevailing intellectual norm in United States tax-policy debates: that is, (allocative) tax policies that unleash market forces—in the case of Figure 5, labor supply—toward productive activities drive economic growth in the long run. The strongest proponents of this view argue either redistributive tax policy is unwanted or redistributive tax policy is unnecessary—allocative tax policies beget redistributive tax-policy outcomes, essentially. Of the two arguments, the latter is the most fragile: a policymaker equipped with fewer instruments than objectives cannot escape trade-offs.
References
Weisman, Steven R. 2002. The Great Tax Wars: Lincoln to Wilson–The Fierce Battles over Money and Power That Transformed the Nation. New York: Simon & Schuster
Additional References
Bénassy-Quéré, Agnès, Benoît Cœuré, Pierre Jacquet, and Jean Pisani-Ferry. 2019. Economic Policy: Theory and Practice. Oxford: Oxford University Press
