
![]() This blog post accompanies the SDPR Morning Macro segment that airs on Monday, May 6.
This blog post accompanies the SDPR Morning Macro segment that airs on Monday, May 6.
Hours before this blogpost published, the Wall Street Journal reported that President Donald Trump announced, in a pair of tweets, that if trade negotiations between the United States and China dragged on much longer, he would significantly increase or newly impose tariffs on $525 billion of imported goods produced in China. Such saber rattling threatens to escalate the current trade war between the United States and China, while it dismays nearly all economists.
Trade is a production technology that increases efficiency, effectively allowing an economy to transform inputs—the goods and services the economy produces at a comparative advantage but does not desire—into outputs—the goods and services the economy desires but does not produce at a comparative advantage. Absent trade, an economy must be self sufficient—an autarky, in the parlance of international economics. An autarky necessarily ignores the objective of productive efficiency and, along with it, (opportunity) cost minimization. All else equal, then, international trade increases an economy’s standard of living.
The terms of trade between nations have always been contentious. And, to be sure, such contentiousness is occasionally warranted; not all terms of trade—including, say, the institutions that govern ownership of intellectual property—are fair. Nevertheless, more often than not, opponents of international trade object to so-called trade imbalances, a pejoratively tinged term that, as a matter of fact, simply describes an aggregate-expenditures outcome in which imports exceeds exports. Exports measure the value of goods and services produced domestically and sold abroad; while imports measure the value of goods and services produced abroad and sold domestically. Most economists do not support this objection or its ostensible corollary: trade imbalances are the work of unscrupulous trading partners. Rather, most economists favor openness and view trade imbalances as the result of domestic features of a macroeconomy.
Typically, macroeconomists measure the degree of an economy’s openness as the sum of the economy’s exports and imports as a share of GDP. Since about the mid-twentieth century, the United States economy has grown increasingly open; this pattern is apparent in Figure 1, in which I illustrate exports and imports as shares of GDP.
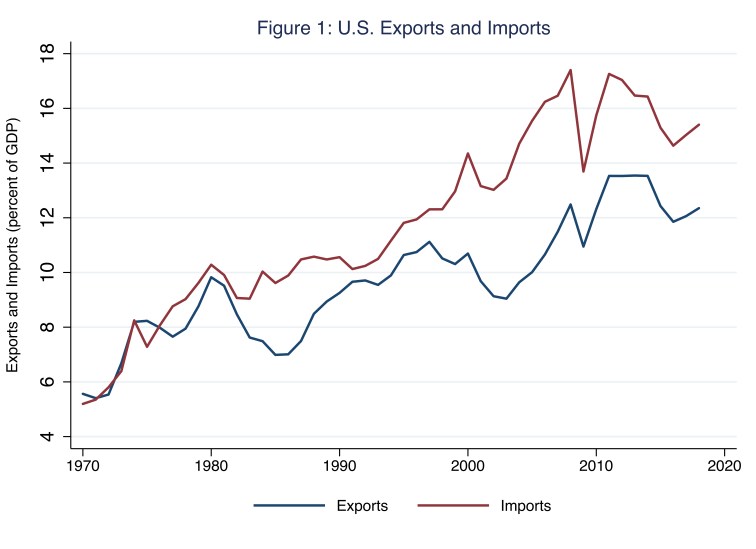
According to Figure 1, in 1970, exports and imports measured, respectively, 5.6 percent and 5.2 percent of GDP; in 2018, these shares measured 12.4 and 15.4 percent of GDP. Thus, measured as the sum of exports and imports, trade of goods and services between the United States and the rest of the world rose from 11 percent of GDP in 1970—about the same share the United States economy recorded forty years earlier—to 27 percent of GDP today. Nevertheless, compared to the rest of the world, the United States remains a relatively closed economy. According to the World Bank, in 2017, the world average sum of country exports and imports as a share of same-country GDP measured 57 percent; the lowest share (of 22 percent) belonged to Sudan, and the highest share (of 413 percent) belonged to Luxembourg. The comparable 2017 shares for, say, Canada and Mexico measured 64 percent and 78 percent, respectively. On the World Bank’s list of hundreds of countries ranked from least to most open, the United States ranked seventh least open in 2017.
Essentially, the market values of exports and imports measure expenditures—the amounts of income that households, firms, and governments spend on exports and imports. And, as it happens (and as we know from the Morning Macro segment, “Measurement Error“), macroeconomists decompose a nation’s GDP (Y) into expenditure components: namely, consumption expenditures (C) by domestic households, investment expenditures (I) by domestic firms, domestic-government expenditures (G), and net-export expenditures (NX), which we measure as export expenditures by foreigners minus import expenditures (M) by domestic households, firms, and governments. We write this decomposition of GDP as follows.
Y = C + I + G + NX
Often, we refer to net exports (NX) as the nation’s trade balance of goods and services. Moreover, we refer to a positive trade balance as a trade surplus, and we refer to a negative trade balance as a trade deficit. In the context of Figure 1, at any moment in time, the trade balance (as a share of GDP) is simply the vertical distance of the gap between the blue and red lines; a trade surplus [deficit] occurs when a point on the blue line is higher [lower] than a point on the red line. In Figure 2, I illustrate the United States trade balance as a share of GDP.
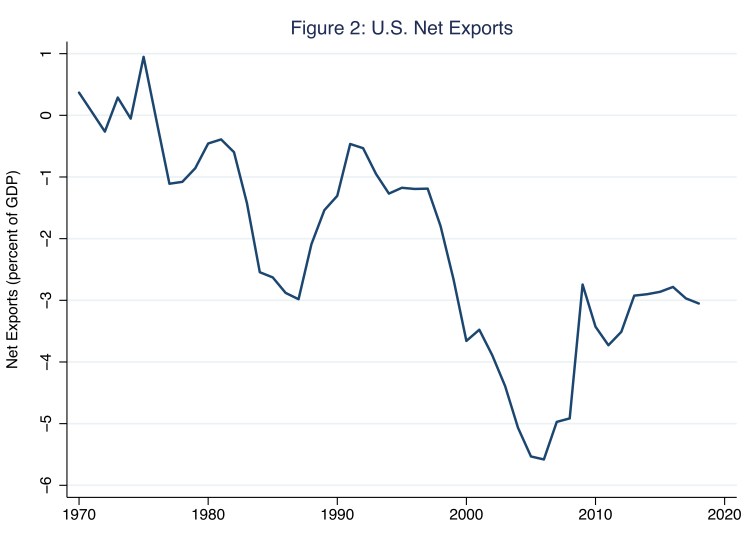
The United States economy has consistently maintained a trade deficit since 1976, before which the country’s relatively small trade balance varied between surplus and deficit. Moreover, as Figure 2 makes clear, trade balances tend to be countercyclical: the balances rise during recessions and fall—think, deficits grow larger in absolute value—during expansions. For example, in 2006, as the economy expanded in the lead up to the Great Recession, the trade deficit registered (negative) 5.6 percent of GDP. Then, in 2009, as the economy reached the trough of the Great Recession, the trade deficit registered (negative) 2.74 percent. This is because, on balance, our nation’s aggregate expenditure on imported goods and services rises and falls along with our domestic income.
Business cycles aside, the source of the trade balance is hidden (in plain sight) in the decomposition of GDP that I specified above. Consider rewriting that decomposition as follows.
(Y – C – G) – I = NX
The term in parentheses is national saving, which economists define as household saving, Y – T – C, where T represents taxes, plus public saving, T – G; thus, adding household saving and public saving yields the expression in parentheses (because the T terms cancel). According to this expression, the trade balance equals the difference between national saving and domestic investment. For concreteness, consider the expression above in the context of a trade surplus, in which case NX is positive. The trade surplus occurs because national saving exceeds domestic investment: on balance, goods and services produced domestically are available to sell abroad, because domestic households, firms, and governments do not collectively purchase all of these goods and services.
To understand the source of the trade deficit that the United States economy has consistently maintained since 1976, consider the expression above in the context of a trade deficit, in which case NX is negative. The trade deficit occurs because national saving falls short of domestic investment: on balance, goods and services produced domestically are not available to sell abroad, because domestic households, firms, and governments collectively purchase these goods and services produced domestically; additionally, these households, firms, and governments purchase some of the goods and services produced abroad as well. Thus, since 1976, aggregate domestic expenditure in the United States has exceeded domestic income. In Figure 3, I illustrate national saving (Y – C – G) and domestic investment (I) as a share of GDP for the United States.
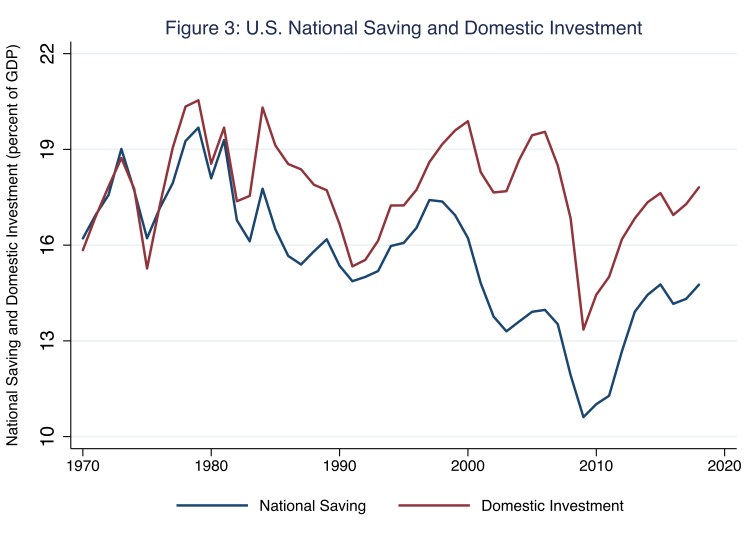
At any moment in time along the x-axis in Figure 3, net exports as a share of GDP (illustrated in Figure 2) is precisely measured as the vertical distance of the gap between the blue and red lines. For example, according to Figure 3, in 2018, national saving as a share of GDP registered 14.8 percent; this measure is indicated by the last data point on the blue line in Figure 3. Meanwhile, domestic investment as a share of GDP registered 17.8 percent; this measure is indicated by the last data point on the red line in Figure 3. The difference between these two measures is 3.0 percent, which is the trade deficit as a share of GDP in 2018; this measure is indicated by the last data point illustrated in Figure 2.
So how does the United States manage to spend beyond its means—measured in terms of GDP? The short answer is that the rest of the world finances the trade deficit that the United States consistently maintains. As we know from the Morning Macro segment, “A Tale of Two Currencies,” macroeconomists account for a country’s international-trade activities using a so-called balance of payments, largely consisting of a current account and a financial account. The current account includes all net income earned for all current economic activities; for simplicity, think of the current account as consisting entirely of NX. The financial account includes all net purchases of foreign assets including bank accounts, bonds, stocks, and fixed capital. If the United States maintains a trade deficit, then, on balance, foreigners hold U.S. assets—for example, dollar-denominated accounts in United States banks that are the source of bank loans to domestic households. In principle, a country’s current and financial accounts must sum to the same amount; the difference between the two accounts—the balance of payments—is zero.
The crucial takeaway from this analysis of patterns of expenditures between the United States and the rest the world is that the trade balance is very largely determined by (domestic) national saving and domestic investment, features of a macroeconomy over which foreigners have relatively little, if any, control. When a positive trade balance exists for the United States, this is because national saving exceeds domestic investment and, thus, on balance, households, firms, and governments in the United States purchase foreign assets. Similarly, when a negative trade balance exists for the United States, this is because national saving falls short of domestic investment and, thus, on balance, households, firms, and governments abroad purchase assets in the United States. Viewed from this perspective, trade balances, and balance-of-payment positions more generally, are neither bad nor good; rather, these positions are simply arithmetic consequences of patterns of domestic income and expenditure.
Thus, in principle, trade wars—unleashed, presumably, to reduce trade deficits—are futile. Trade wars reduce trade—the level of exports and the level of imports—not trade deficits. And, despite often-repeated claims to the contrary, trade wars do not pay for themselves in the form of, say, customs duties collected from taxing imports. In Figure 4, I illustrate the customs duties the United States federal government has collected, as a share of total current tax receipts, before and during the current trade war between the United States and, for the most part, China.
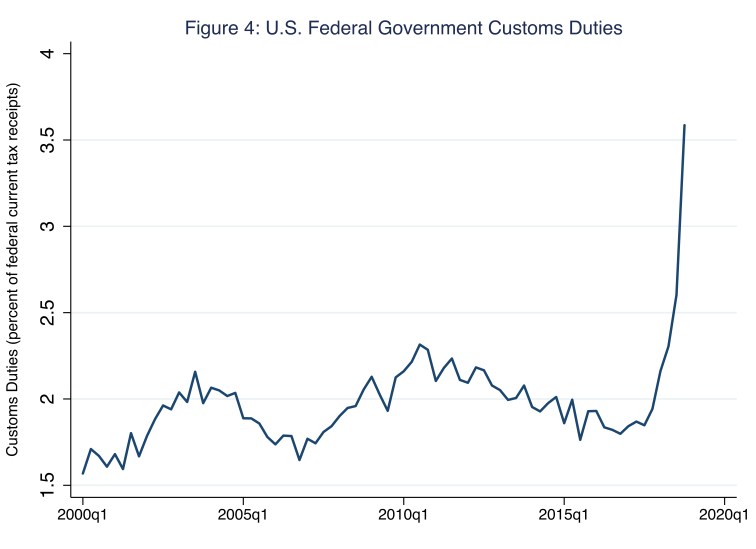
According to Figure 4, in the fourth quarter of 2018, the customs duties the United States federal government collected as a share of current tax receipts registered 3.6 percent, or $72.4 billion on an annual basis—a relatively paltry sum given that the concomitant trade disruptions, including tariff retaliations, have been far more costly. And, in any case, the tax burden of this $72.4 billion has been effectively borne by price-taking domestic households, firms, and governments.
Okay, so trade wars are never won; they are unforced policy errors, full stop. Why, though, do countries negotiate trade agreements, often codifying something less than free trade? Not surprisingly, perhaps, the reality is that not all trade is fair. Although national saving and domestic investment largely determine trade balances, countries can unfairly influence the terms of trade with other countries, at least in the short run, in order to advantage local producers, for example. Put differently, the less than free-and-fair trade we often accept (in the forms of, say, NAFTA or TPP) is a second-best solution—free and fair trade is first best solution—in an imperfect and necessarily political world. So, while existing trade deals may not be perfect, abrogating them in search of the perfect deal is a fool’s errand. Today, this idea of the second-best solution in the context of economic policy—and, in this case, trade policy—is conventional wisdom thanks, in large part, to the work of Avinash K. Dixit.
In 1994, the Center for Economic Studies (CES) at the University of Munich named Dixit its inaugural Distinguished CES Fellow and invited him to deliver that year’s Munich Lectures in Economics (December 13-15, 1994). Speaking on “Economic Policies and the Political Process,” Dixit encouraged economists to recognize how transaction cost politics shape the economic policymaking process. Dixit’s piercing, insightful analysis transformed (and greatly improved) how economists think about and craft economic policy. In 1996, The MIT Press published Dixit’s lectures in a now-classic monograph titled, The Making of Economic Policy: A Transaction-Cost Politics Perspective, a SCHOOLED must read, and here’s why.
Dixit (1996) tells us to organize our analysis of trade negotiations around the theme of transaction cost politics—a thinly veiled reference to the field of transaction cost economics and the intellectual contributions of Nobel laureate Oliver Williamson among others. Parties to a contract incur transaction costs because of informational asymmetries, time-inconsistent behavioral rules, and bounded rationality; the latter is caused by the subjective and, often, incorrect assumptions individuals make to explain their complex economic environment (North 1990, 355). Essentially, markets are imperfect, so parties to a contract incur the transaction costs of preserving their economic interests.
As Williamson (1989) eloquently explains, “Transaction cost economics pairs the assumption of bounded rationality with a self-interest seeking assumption that makes allowance for guile. Specifically, economic agents are permitted to disclose information in a selective and distorted manner. Calculated efforts to mislead, disguise, obfuscate, and confuse are thus admitted. This self-interest-seeking attribute is variously described as opportunism, moral hazard, and agency” (139). Transaction cost politics, then, applies transaction cost economics to the inherently political economic-policymaking process, where contracts incompletely specify terms of political transactions consummated in imperfect political markets.
Thus, organizing our analysis of trade policymaking around the theme of transaction cost politics means thinking about policy acts (and the institutions, rules, and procedures that shape these acts) as second-best solutions; that is, solutions that respect the transaction-cost constraints imposed on parties to political contracts. This is not to say that we cannot improve economic policies or their outcomes. Unnecessarily bad economic policies happen, of course; and we may be able to reduce transaction costs. Rather, the point is simply that “a would-be policy innovator would do well to think of whether the existing setup is…making the best of the world’s imperfections” Dixit (1996, 147). A bigger, better deal may be unattainable due to transaction-cost constraints.
To see why, suppose two countries are potential parties to a trade agreement. As usual, the model is symmetric—identically sized economies, export sectors, and so on—and we abstract from internal politics. Consider the social welfare of a representative country in a given period, when Τ is the tariff rate this representative country imposes and τ is the tariff rate the other country imposes. In a single-period, noncooperative play of this game, the Nash equilibrium is Τ = τ*, because τ* is the optimal tariff rate given that the other country will impose it as well. Finally, suppose the two countries rightly recognize a multi-period, cooperative game of free trade, where both countries choose a tariff rate of zero, is the first-best solution.
Again here, this first-best solution disregards the transaction costs imposed by the time-inconsistent nature of the policy contract: absent a credible commitment mechanism, at some sufficiently low cooperative tariff rate, each country has an incentive to cheat—that is, unilaterally impose a higher tariff rate once and, thereafter, revert to the Nash equilibrium. To see this graphically, consider Illustration 1, which depicts hypothetical benefits and costs of cheating for a representative country (Dixit 1996, 75). The benefits of cheating are given by the red curve B(τ), which represents the immediate gains in social welfare from cheating and, thus, imposing a higher tariff rate once; the costs of cheating are given by the blue curve C(τ), which represents the present values of social welfare lost because of leaving the cooperative equilibrium forever. The Nash equilibrium rate is τ* and the cooperative “free-trade” rate is τ**, a second-best solution because τ** ≠ 0.
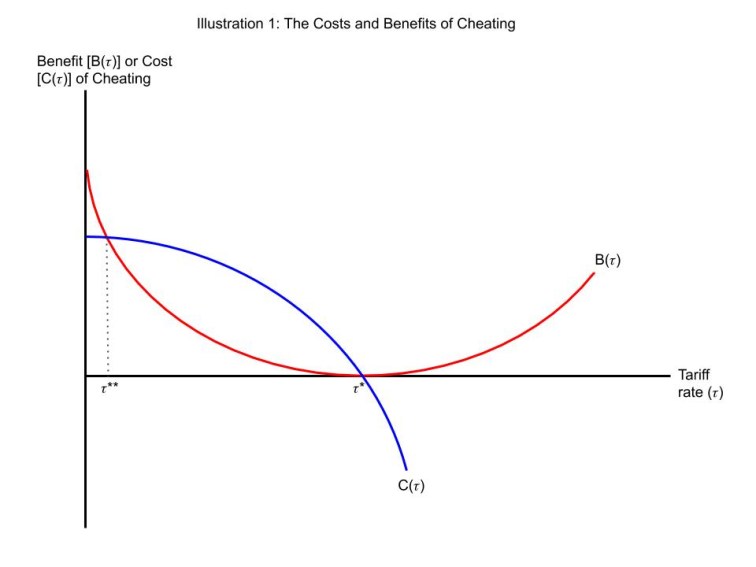
The absence of a credible enforcement mechanism—a transaction cost—leaves the first-best solution unattainable: at a tariff rate sufficiently near zero, the incentive to cheat is too great because B(τ < τ**) > C(τ < τ**). Thus, the countries have two options: the Nash equilibrium, in which the social-welfare benefits to freer trade accrue to neither country, or freer trade at tariff rate τ**. Free trade at tariff rate zero is not an option: it is constrained by the transaction cost imposed by a contract that fails to specify the terms of a credible commitment mechanism in this imperfect political market.
So, trade agreements often impose less-than free trade, thanks to transactions costs. And trade wars are never won. As this analysis of the costs and benefits of cheating demonstrates, we do well to analyze trade policy around the theme of transaction cost politics, which recognizes that political markets are at least as imperfect as economic markets; and, thus, political agents—including those who lobby for, craft, and legislate economic policy—must incur transaction costs in order to preserve their economic interests. Reducing the performance wedge between first- and second-best outcomes requires reducing transaction costs, generally by increasing the power of incentives in economic policies. In the case of the trade agreement, for example, streamlining and, thus, quickening dispute-resolution processes, the antithesis of a drawn-out trade war, would decrease the benefits of cheating—shifting the B(τ) curve down in Illustration 1—and, thus, achieve freer trade.
References
Dixit, Avinash K. 1996. The Making of Economic Policy: A Transaction-Cost Politics Perspective. Cambridge: The MIT Press.
North, Douglass C. 1990. “A Transaction Cost Theory of Politics.” Journal of Theoretical Politics 2, no. 4: 355-367.
Williamson, Oliver E. 1989. “Transaction Cost Economics.” In Handbook of Industrial Organization, Volume I, eds. Richard Schmalensee and Robert Willig. Amsterdam: North-Holland, pp. 135-182.

3 thoughts on “traitors”