
![]() This blog post accompanies the SDPR Morning Macro segment that airs on Monday, December 16.
This blog post accompanies the SDPR Morning Macro segment that airs on Monday, December 16.
Last Friday, December 13th, the U.S. Census Bureau reported its advanced estimates for retail and food-services sales for November 2019. The report underwhelmed, signaling lower-than-expected sales during a crucial holiday-shopping month. According to the Wall Street Journal, “Consumers held back on purchases of discretionary items ranging from clothes to restaurant meals.”
Americans consume; it’s what we do.
So, it’s probably no surprise that in the U.S., consumers drive a large share of macroeconomic activity, which we measure according to Gross Domestic Product (GDP). As Schooled readers will recall from an earlier Morning Macro segment, “Measurement Error,” GDP measures the market value of all final goods and services produced within an economy over an interval of time, typically over a year. In the U.S, the Bureau of Economic Analysis (BEA) computes and reports on GDP each quarter. Generally speaking, we can think about GDP two ways: namely, the total income of everyone participating in the economy (this is the so-called income approach) or the total expenditure—by households, firms, governments, and foreigners—on the economy’s output of goods and services (this is the so-called expenditure approach). Both ways of thinking about GDP are valid, because for the economy as a whole, domestic income must equal domestic expenditure; or, put differently, every transaction has a seller—think, income—and a buyer—think, expenditure.
By definition, households consume, firms invest (in machinery and equipment, for example), governments spend, foreigners purchase our exports, we purchase foreigners’ imports, and the difference between exports and imports is net exports. Macroeconomists refer to the household-expenditures component of GDP as personal consumption expenditures. In Figure 1, I illustrate the four expenditure components that comprise GDP annually; net exports comprise an area (in blue) below the x-axis because net-export expenditures have been negative—we have purchased more foreign goods and services than foreigners have purchased of our goods and services. (For more on the trade balance, and trade policy more generally, see the Morning Macro segment, “Traitors.”)
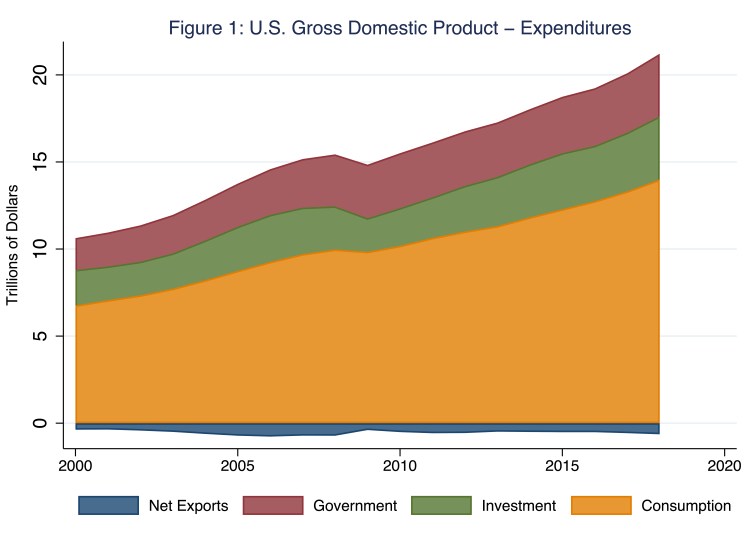
According to Figure 1, personal consumption expenditures—hereafter, consumption expenditures—comprise the largest share (indicated by the amber-colored area) of aggregate expenditures—the sum of consumption, investment, government, and net-export expenditures–and, thus, GDP. (In formal BEA speak, government expenditures are government consumption expenditures and gross investment; in this blog post, I will refer to the entire category as simply government expenditures.) For example, in 2018, consumption expenditures registered $14 trillion, or 68 percent of GDP of $20.6 trillion that year. This pattern has been rather consistent throughout most of the last century; a noted exception—a brief fall of the consumption-expenditures share of GDP to roughly 49 percent—occurred, not surprisingly, near the end of the Second World War. Meanwhile, investment-expenditures and government-expenditures shares of GDP have roughly mirrored each other; for example, in 2018, each share registered roughly 17.5 percent of GDP.
So consumption expenditures comprise roughly two thirds of GDP; and two thirds is a really large share. Nevertheless, macroeconomists care more about the growth of GDP over time than they do about the level of GDP (and, thus, the consumption-expenditures share of GDP) at a moment in time; the past is, after all, the past. In Figure 2, I illustrate the contributions of consumption, investment, government, and net-export expenditures to the annual growth in real GDP, where the height of, say, the blue bar indicates the percentage-points growth of real GDP attributable to consumption expenditures.
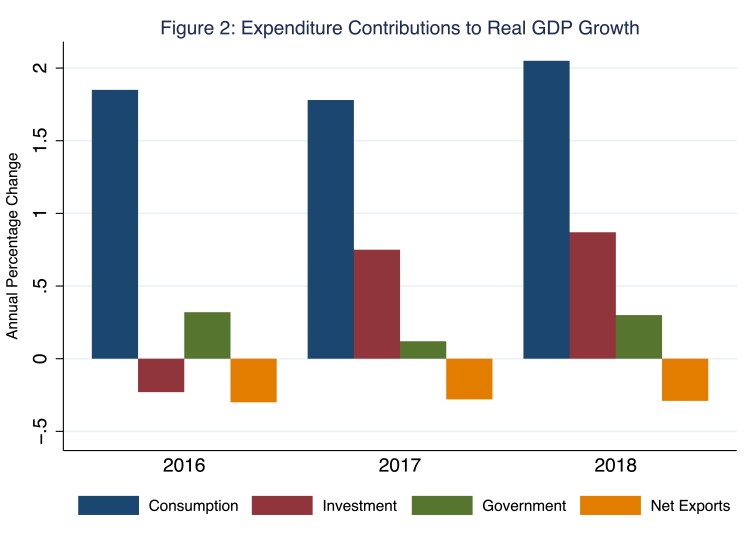
According to Figure 2, annual growth of consumption expenditures contribute most to the annual growth of real GDP. Consider, for example, the bars associated with 2018, when the annual growth of real GDP registered 2.93 percentage points—the sum of the heights of the four bars associated with 2018. Of these 2.93 percentage points of economic growth, consumption expenditures (in blue) contributed 2.05 percentage points, investment expenditures (in maroon) contributed 0.87 percentage points, government expenditures (in green) contributed 0.30 percentage points, and net-export expenditures (in amber) contributed negative 0.29 percentage points. Put differently (and somewhat sensationally), but for the growth of consumption expenditures, the growth of real GDP in 2018 would have registered an abysmal 0.85 percentage points of intentional growth (and the remaining 2.08 percentage points of growth would have comprised a massive unintended accumulation of inventories—investment expenditures, according to the BEA).
Almighty consumer, indeed.
And what, you may ask, are these households consuming? Generally speaking, macroeconomists separate consumption expenditures into three categories: durable goods (think, refrigerators and automobiles), nondurable goods (think, peanut butter and apples—a personal favorite), and services (think, haircuts and dental care). For the most part, households are consuming services. This pattern is visible in Figure 3, where I illustrate these categories of consumption expenditures since 2000; the height of blue (durable goods), maroon (nondurable goods), and green (services) areas combined equal the height of the amber area in Figure 1.
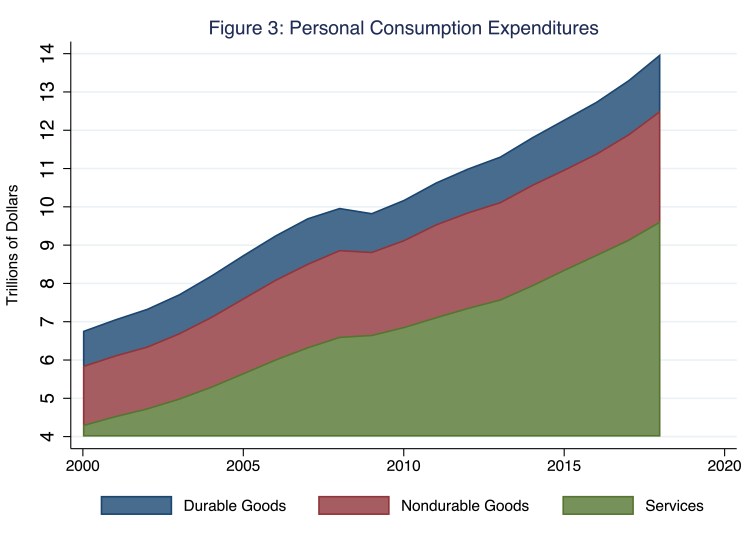
According to Figure 3, in 2018, consumption expenditures on services registered roughly $9.6 trillion, or roughly 69 percent of total consumption expenditures of $14 trillion that year; the comparable figures for durable and nondurable goods were, respectively, 10 percent and 21 percent of total consumption expenditures that year. Again, perhaps more importantly than the levels of the various categories of consumption expenditures are their growth rates, which, in turn, drive their contributions to the growth of GDP. In Figure 4, I illustrate the annual growth of real—that is, inflation-adjusted—consumption expenditures, in total and separated into growth in expenditures on durable goods, growth in expenditures on nondurable goods, and growth in expenditures on services.
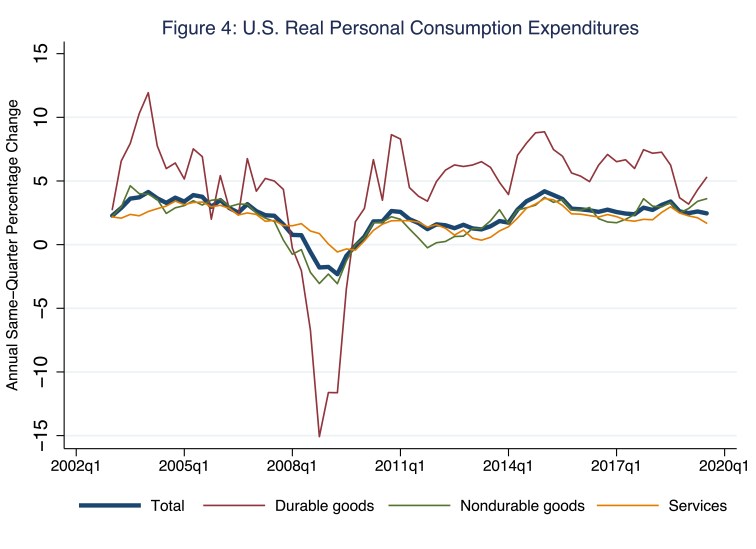
According to Figure 4, consumption expenditures are reliably pro-cyclical—as goes the business cycle, so go consumption expenditures, which rise during expansions and fall during contractions. (For more on the business cycle, see the Morning Macro segment, “Growing Old(er).”) Though, as you might expect, not all categories of consumption expenditures are equally pro-cyclical: expenditures on apples and peanut butter (nondurables), and haircuts and dental care (services), say, are less sensitive to the business cycle, while expenditures on refrigerators and automobiles (durables) are more sensitive to the business cycle. Consider, for example, the growth path of consumption expenditures during the Great Recession, when expenditures on durable goods (the maroon line in Figure 4) fell dramatically, while expenditures on the other components remained relatively stable. Macroeconomists refer to the relative stability of consumption expenditures as smooth; that is, over time, households consume independently of their current income: this is to say, households smooth consumption.
Consumption smoothing implies that households effectively consume their permanent income.
Read that again, because it’s that important.
Consumption smoothing implies that households effectively consume their permanent income.
The implications of consumption smoothing, a revolution in macroeconomic thinking we most associate with Milton Friedman and the so-called permanent-income hypothesis, is deceptively profound; and, before you dismiss it as a bunch of macroeconomic theory, know that you very likely behave as the hypothesis predicts. Permanent income refers to the household’s (annuitized) present value of its lifetime expected earnings; because these earnings are generated in the future, these earnings are currently unknowable. Thus, household expectations about permanent income drive current consumption. Incidentally, this relationship between consumption expenditures and expectations of the path of future income is precisely why macroeconomists track consumer sentiment so closely; consider, for example, the popularity of the University of Michigan’s consumer sentiment surveys or the retail-sales announcements—the outcomes of surveys as well—that I mentioned earlier in this post.
Consuming your permanent income means consuming in a way that you expect you can afford over your lifetime, though maybe not at this moment in time. Generally speaking, at any moment in time, current household income likely differs from permanent household income. Consider, for example, a university student who earns relatively low income today but who expects (reasonably so) to earn relatively high income in the future; this student likely consumes in a way that is consistent with her permanent income, rather than in a way that is consistent with her (paltry) current income, and who could blame her? This means that, at any moment in time, some households are saving current income into the future (because current household income is greater than permanent household income) and some households are borrowing against future income (because current household income is less than permanent household income); the latter households incur debt. In Figure 5, I illustrate household debt, which I separate into mortgage debt, student-loan debt, auto-loan debt, credit-card debt, and other debt.
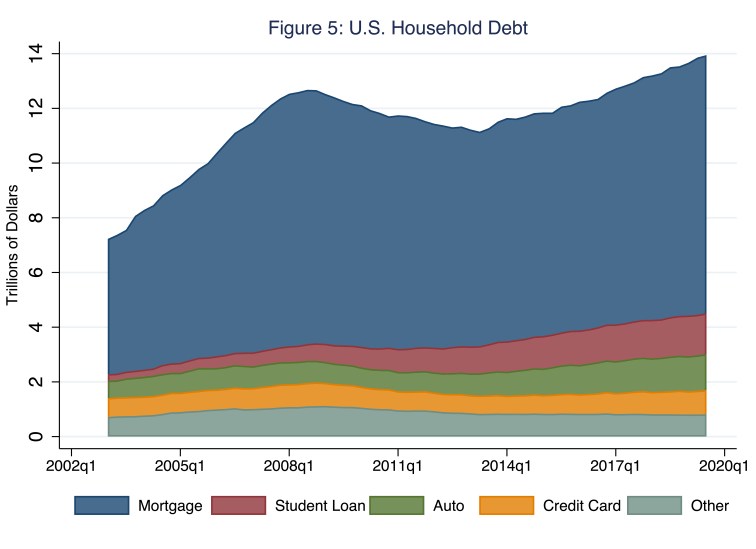
According to Figure 5, as of the third quarter of 2019, household debt registered roughly $14 trillion, of which mortgage debt comprised the largest share at 68 percent of total household debt, followed by student-loan debt (11 percent of total household debt), auto-loan debt (9 percent), and credit-card debt (6 percent). Total household debt rose leading up to the Great Recession and, then, fell as households tightened their budgets—saving into the future, as it were, in anticipation of lower permanent income, perhaps. Today, at roughly $14 trillion, total household debt is higher than the peak of $12.7 trillion that this series registered in the third quarter of 2008. Of course, the level of household debt is more meaningful if we compare it to the level of disposable personal income, because the ratio of debt to income offers a more informed sense of the sustainability of household debt. (Households that cannot sustain their debt go bankrupt.) In Figure 6, I illustrate total household debt (from Figure 5) as a share of disposable personal income, a measure that rises [falls] when the level of total household debt rises [falls] relative to the level of disposable personal income; so, for example, the ratio illustrated in Figure 6 could rise simply because the level of debt remains unchanged while disposable personal income falls, as it did during the Great Recession.
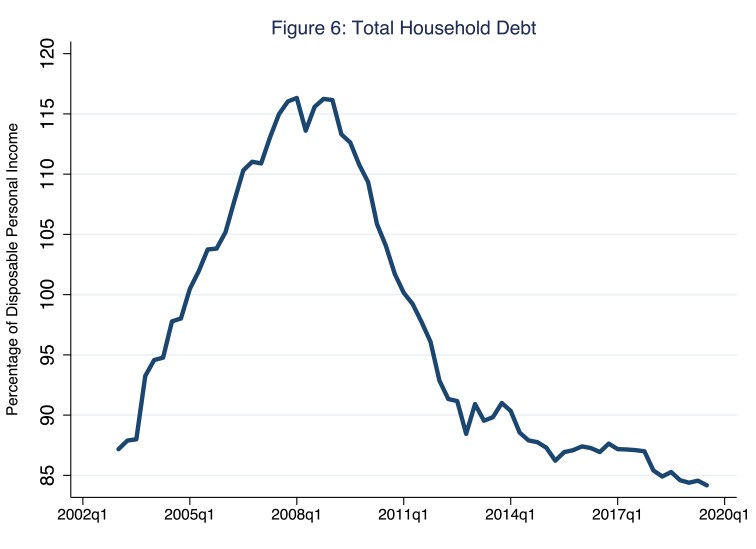
In the lead up to the Great Recession, total household debt as a share of disposable personal income rose to roughly 116 percent as total household debt rose (Figure 5) while (nominal) GDP growth slowed dramatically. Since the Great Recession, total household debt as a share of disposable personal income has fallen rather dramatically; as of the third quarter of 2019, this share registered roughly 84 percent. Of course, although the level of total household debt is important, as a practical matter, what determines whether a household can manage its debt in the near term is the financial burden that the household’s debt-service payments impose. In Figure 7, I illustrate household debt-service payments—monthly mortgage, auto, and credit-card payments, for example—as a share of disposable personal income, a measure that rises [falls] when the level of debt-service payments rises [falls] relative to the level of disposable personal income; so, for example, the ratio illustrated in Figure 7 could rise simply because debt-service payments remain unchanged while disposable personal income falls, as it did during the Great Recession.
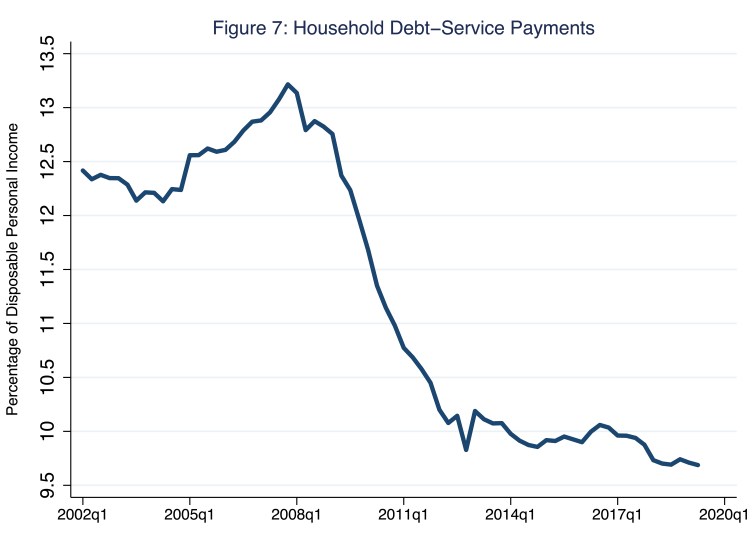
As of the second quarter of 2019, household debt-service payments as a share of disposable personal income registered 9.7 percent, the lowest reading in the history of this data series, which dates to the first quarter of 1980. Thus, since the Great Recession, households have, in the aggregate, reduced debt and debt-service payments as shares of personal disposable income. In effect, households have accomplished this, on balance, by increasing saving rates in a growing economy amidst exceptionally low interest rates; since the Great Recession, households have been saving larger shares of a growing amount of disposable personal income, while low interest rates have reduced the cost of servicing existing levels of household debt. In Figure 8, I illustrate the personal saving rate as a percentage of disposable personal income.
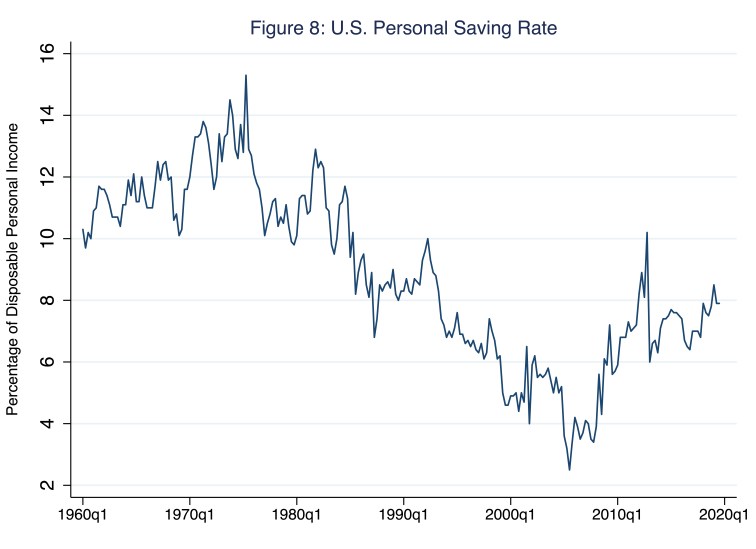
In the lead up to the Great Recession, household saving fell to a low of 2.7 percent (in August, 2005), as households’ expectations of their permanent income rose (in anticipation of real-estate capital-gain income, perhaps). In the wake of the Great Recession, households tightened their budgets substantially, as the saving rate peaked at 12 percent in December 2012. Since then, the saving rate has remained at the relatively high rate of about 8 percent.
On balance, Americans consume—a lot; consumption drives aggregate expenditure and, at least in the short run, expenditure drives GDP. Americans also borrow—a lot. Household expenditure and household debt are closely related, according to the permanent-income hypothesis, because, over time, households smooth consumption in response to their permanent—not current—income. As of now, the greatest near-term threat to the household balance sheet (which, in the aggregate, is relatively strong) is an economic contraction, during which household debt and debt-service burdens would rise as disposable personal income fell, an outcome that could reduce (expected) permanent income and, thus, trigger further declines in household consumption expenditures.

One thought on “all consuming”