
![]() This blog post accompanies the SDPR Morning Macro segment that airs on Monday, November 18.
This blog post accompanies the SDPR Morning Macro segment that airs on Monday, November 18.
The U.S. economy has been in the expansion phase of its business cycle since the second quarter of 2009—the end of the Great Recession a decade ago. An expansion is one of four so-called phases of a business cycle; the other three phases are peak, contraction (aka, recession), and trough. The business cycle refers to irregular fluctuations in aggregate economic activity that are reflected broadly throughout the economy; so, for example, a decline in automobile-manufacturing, tax-consulting, or software-engineering activity does not, by itself, constitute a contraction. In Figure 1, I illustrate the phases of a (very stylized) business cycle, which oscillates around a long-run growth trend indicted by a dashed, red line. (For more on long-run growth, see the Morning Macro segment, (Iron) Curtain Call.)
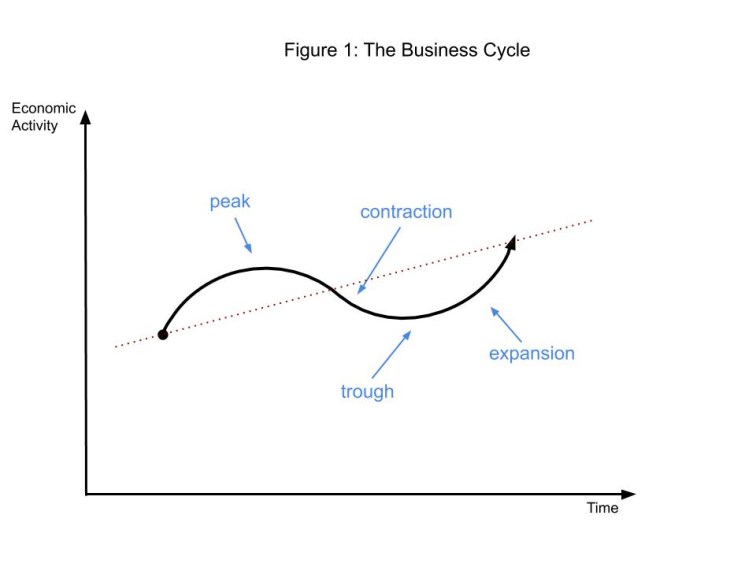
As Figure 1 illustrates, an expansion occurs during the period between the trough—the lowest level of economic activity in the cycle—and the peak—the highest level of economic activity in the cycle. Analogously, a contraction occurs during the period between the peak and the trough. Peaks and troughs are, as a practical matter, relatively short-lived turning points in the cycle. Generally speaking, expansions tend to last longer than contractions. In Table 1, I report business-cycle trough and peak dates, along with the duration (in months) of each corresponding expansion; thus, in Table 1, contractions occur during the period between the peak and the trough dates.
Table 1: Select U.S. Business-Cycle Troughs, Peaks, and Expansion Durations
Source: National Bureau of Economic Research
| Trough Date | Peak Date | Months (#) |
| October 1945 (Q4) | November 1948 (Q4) | 37 |
| October 1949 (Q4) | July 1953 (Q2) | 45 |
| May 1954 (Q2) | August 1957 (Q3) | 39 |
| April 1958 (Q2) | April 1960 (Q2) | 24 |
| February 1961 (Q1) | December 1969 (Q4) | 106 |
| November 1970 (Q4) | November 1973 (Q4) | 36 |
| March 1975 (Q1) | January 1980 (Q1) | 58 |
| July 1980 (Q3) | July 1981 (Q3) | 12 |
| November 1982 (Q4) | July 1990 (Q3) | 92 |
| March 1991 (Q1) | March 2001 (Q1) | 120 |
| November 2001 (Q4) | December 2007 (Q4) | 73 |
| June 2009 (Q2) | ? | 124 |
The National Bureau of Economic Research (NBER), a private, non-profit, non-partisan research institution located in Cambridge, Massachusetts, is the source of the information in Table 1. Macroeconomists look to the NBER Business Cycle Dating Committee to identify peaks and troughs—and, thus, expansions and contractions—in the business cycle. The NBER Business Cycle Dating Committee describes its method for dating a peak or a trough this way:
The Committee does not have a fixed definition of economic activity. It examines and compares the behavior of various measures of broad activity: real GDP measured on the product and income sides, economy-wide employment, and real income. The Committee also may consider indicators that do not cover the entire economy, such as real sales and the Federal Reserve’s index of industrial production (IP). The Committee’s use of these indicators in conjunction with the broad measures recognizes the issue of double-counting of sectors included in both those indicators and the broad measures. Still, a well-defined peak or trough in real sales or IP might help to determine the overall peak or trough dates, particularly if the economy-wide indicators are in conflict or do not have well-defined peaks or troughs.
According to Table 1, since the Second World War, the U.S. economy has experienced twelve expansions. Of these expansions, the shortest occurred during the period between the trough in July 1980 and the peak in July 1981; this seemingly brief interruption in contractionary economic activity—from February to July, 1980 and from August 1981 to November 1982—exemplifies the informed judgement inherent in the NBER’s approach to dating a business cycle. To be sure, in describing its cycle-dating method, the NBER calls out this expansion in particular, writing, in part:
The Committee…has no fixed rule to determine whether a contraction is only a short interruption of an expansion, or an expansion is only a short interruption of a contraction. The most recent example of such a judgment that was less than obvious was in 1980–1982, when the Committee determined that the contraction that began in 1981 was not a continuation of the one that began in 1980, but rather a separate full recession.”
In any case, expansions during the 1960s and the 1990s and our current expansion stand out as exceptionally long lived; and of these, the current expansion is the longest lived. Of course, no two expansions are identical. For example, although the current expansion, which has lasted over 124 months, is exceptionally long, the growth of aggregate economic activity (reflected broadly throughout the economy) that has attended this expansion has been exceptionally weak. In Figure 2, I illustrate these somewhat-offsetting features of the current expansion, which I compare to nine other U.S. expansions—including the 1960s and 1990s expansions—since the Second World War; I use real gross domestic product (GDP) as my proxy for aggregate economic activity.
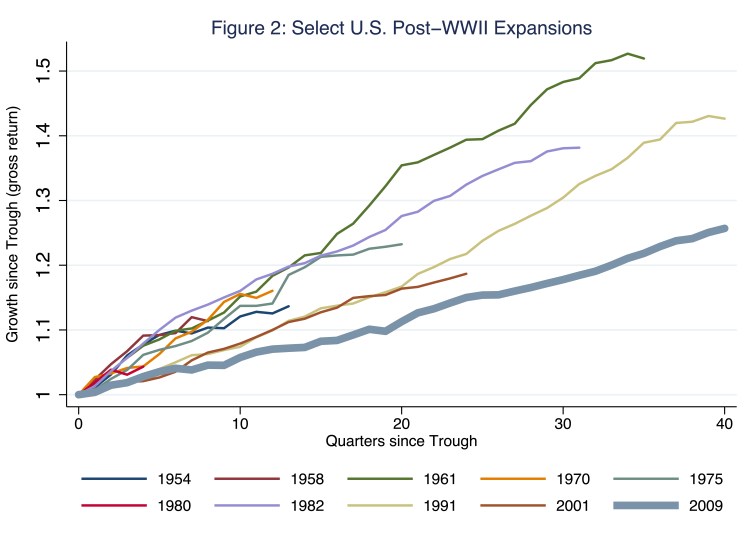
In Figure 2, I illustrate the time path of each expansion in relation to the level of real GDP that the economy registered in the trough that preceded the expansion. The longer the line (measured along the x-axis), the longer the expansion. Moreover, for each expansion, the y-axis value that corresponds to zero quarters since the trough—that is, the quarter that the economy was in the trough—is 1, the ratio of real GDP in the trough to real GDP in the trough; whereas, for each expansion, the y-axis value that corresponds to, say, ten quarters since the trough is a number greater than 1, the ratio of real GDP ten quarters since the trough to real GDP in the trough.
Consider, for example, the current expansion (indicated by the thick, blue line) that began in 2009. For this expansion, the y-axis value that corresponds to, say, twenty quarters since the trough—that is, five years out from the Great Recession—is 1.11, the ratio of real GDP twenty quarters since the trough to real GDP in the trough. Put differently, then, five years out from the Great Recession, U.S. real GDP was eleven percent higher than it was in the trough of the Great Recession. Thus, the steeper the line in Figure 2, the higher the gross growth rate of real GDP associated with the expansion.
The line associated with the current expansion is the longest, so the current expansion is the longest in Post-WWII U.S. history. Meanwhile, the line is the least steep, so the current expansion is the weakest (in terms of the growth of economic activity that characterizes the expansion). To understand the economic significance of this last feature, compare the current expansion to those during 1960s (indicated by the dark-green line) and the 1990s (indicated by the light-green line). The cumulative growth rates of real GDP thirty-six quarters—nine years—into the 1960s and 1990s expansions were, respectively, 52 percent and 39 percent; the corresponding cumulative growth rate of real GDP for the current expansion is 22 percent. So, the current expansion has proven, at once, exceptionally long and exceptionally weak.
Why the current expansion has been so weak is, well, complicated; though, the source of the weakness surely has something to do with the severe financial crisis that preceded the expansion. Financial crises tend to leave a mark. To be sure, the deterioration in economic activity that the Great Recession left in its wake was exceptionally severe, the worst since the Great Depression; though the Great Depression was an order of magnitude worse than the Great Recession—the subject of a future Morning Macro. In Figure 3, I illustrate the loss of real GDP associated with each of ten Post-WWII contractions—those adjacent to the expansions that I identify in Figure 2.
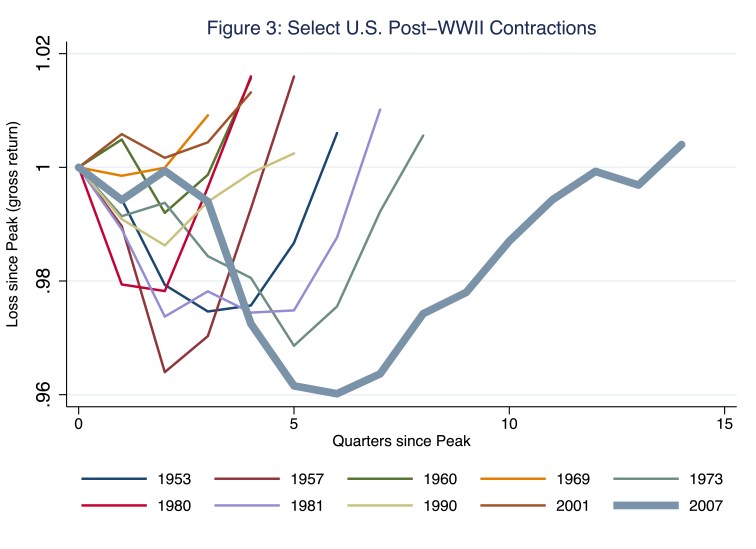
In Figure 3, I illustrate the time path of each contraction in relation to the level of real GDP that the economy registered in the peak that preceded the contraction. Figure 3 is the contractionary counterpart to Figure 2. Thus, the longer the line (measured along the x-axis), the longer the contraction. Moreover, for each contraction, the y-axis value that corresponds to zero quarters since the peak—that is, the quarter that the economy was in the peak—is 1, the ratio of real GDP in the peak to real GDP in the peak; whereas, for, say, each contraction that lasted five or more quarters, the y-axis value that corresponds to five quarters since the trough is a number less than 1.
Consider, for example, the Great Recession (indicated by the thick, blue line). For this contraction, the y-axis value that corresponds to, say, five quarters since the peak—that is, fifteen months into the Great Recession—is 0.97. Put differently, then, in the fifth quarter of the Great Recession, U.S. real GDP was roughly 3 percent less than it was during the peak just prior to the Great Recession. Thus, the accumulated loss in economic activity associated with a contraction is, graphically speaking, the area between the y-axis value of 1 and the line associated with the corresponding contraction. Thus, the deeper and longer the dip illustrated in Figure 3, the greater the accumulated loss of real GDP associated with the contraction. So, yes, if by great we mean destructive, then the Great Recession was really, really great.
Okay, so are business cycles uniquely American? No.
The general features of business cycles—relatively long expansions, relatively short contractions—are common to all market-oriented economies, in which aggregate shocks (including, potentially, macroeconomic-policy shocks) buffet economic activity for better and for worse. In Table 2, I report the average lengths and counts of business-cycle contractions and expansions since the 1950s (or the soonest thereafter that data are available) for a selection of countries, including the U.S.; I base this information on the Organization for Cooperation and Development (OECD) recession indicators, which offer a consistent measure of business cyclicality, even though these indicators may signal a business-cycle turning point more often than other indicators, such as those unique to each country’s official statistics agency. (Australia comes to mind; more on it below.)
Table 2: Select Country Contractions and Expansions
Source: Federal Reserve Bank of St. Louis; OECD recession indicators as of June 2019
| Contractions | Expansions | |||
| Country | Length (months) | Count | Length (months) | Count |
| Australia (’61:11) | 11 | 13 | 31 | 13 |
| Canada (’62:03) | 9 | 15 | 27 | 15 |
| China (’79:01) | 11 | 9 | 31 | 9 |
| Germany (’60:12) | 12 | 14 | 30 | 13 |
| Japan (’62:01) | 10 | 15 | 26 | 15 |
| Mexico (’62:10) | 12 | 12 | 33 | 12 |
| Spain (’63:05) | 12 | 13 | 31 | 12 |
| Sweden (’61:03) | 14 | 12 | 31 | 12 |
| U.K. (’55:10) | 12 | 14 | 31 | 14 |
| U.S. (’57:09) | 6 | 9 | 71 | 9 |
The start date of each country dataset appears in parentheses in column 1. According to Table 2, all economies experience business cycles and, on average, expansions last longer than contractions. However, the U.S. is conspicuously unique in two respects: for the period covered in Table 2, U.S. expansions have lasted a lot longer than U.S. contractions—on average, U.S. expansions have lasted for 71 months whereas U.S. contractions have lasted for 6 months—and U.S. expansions have lasted longer than expansions in other countries (according to column four in Table 2).
So, is the current U.S. expansion old, or just older?
To be sure, the current U.S. expansion has been unprecedentedly long, by U.S. and international standards. Consider, for example, Figure 4, in which, for each country listed in Table 2 that is currently in the expansion phase of its business cycle, I illustrate the time path of the expansion in relation to the level of real GDP that the economy registered in the trough that preceded the expansion.
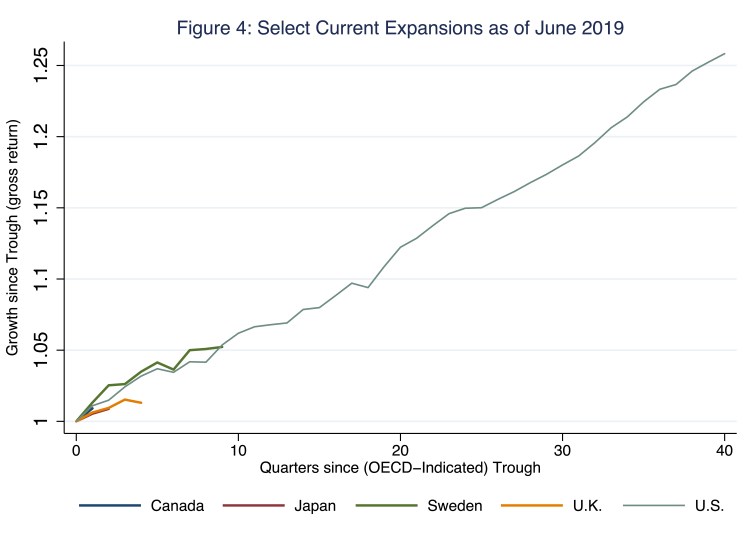
In Figure 4, the current U.S. expansion (indicated by the thin, light-green line) is the very same (dark-green) line that I illustrate in Figure 2. Of the countries listed in Table 2, those countries in the expansion phase of the business cycle include, along with the OECD dates of the latest trough, Canada (February, 2019), Japan (October, 2018), Sweden (December, 2016), the U.K (April, 2018), and, of course, the U.S. (June, 2009). Though, to be fair, if we overlook the relatively mild, short-lived tendencies toward recession in Australia over the last quarter century, tendencies that cause the OECD indicators to signal recession in that country, Australia’s economy has experienced a business-cycle expansion for about the last twenty-seven years. In any case, the current U.S. expansion is older than most; but, is it old—as in, soon to expire?
In principle, expansions do not die of old age; they’re murdered.
The intellectual history of business-cycle theory is long and rich. Much of it begins with John Maynard Keynes and his General Theory of Employment, Interest, and Money, published in 1936; the timing of the publication with the Great Depression is not coincidental. According to Keynes, fluctuations in macroeconomic activity are largely caused by aggregate shocks to the economy that are independent—or, exogenous—of its structure, including its phase of the business cycle. Keynes reasoned the sources of these shocks might be so-called animal spirits—broadly experienced surges of ultimately self-fulfilling commercial optimism and pessimism, for example. Later business-cycle theories added microeconomic foundations to their macroeconomic models and included several other likely sources of aggregate shocks, including, for example, technology shocks, money-demand shocks, financial crises, and policy shocks—think, excessively tight monetary policy or excessively protectionist trade policy, for example. In any case, although no two business-cycle theories are exactly alike, no theory predetermines the lifecycle of an expansion. In principle, the current expansion is older than most; it may or may not be old.
References
Keynes, John. M. 1936. The General Theory of Employment, Interest, and Money. New York: Harcourt, Brace and Company.

5 thoughts on “growing old(er)”