
This blog post accompanies the SDPB Monday Macro segment that aired on Monday, July 31, 2023. Click here to listen to the segment. For more macroeconomic analysis, follow J. M. Santos on Twitter @NSMEdirector.
Schooled readers and Monday Macro listeners know the drill by now: since the pandemic, extraordinary growth in aggregate demand fueled by extraordinary growth in fiscal and monetary policies—think, stimulus checks and near-zero interest rates, respectively—combined with contractions in aggregate supply—think, supply-chain troubles—reduced the purchasing power of money. This is to say, since the pandemic, the rate of inflation has risen substantially; only recently has the rate slowed. In Figure 1, I illustrate this familiar pattern using year-over-year consumer-price inflation, which I decompose into durable goods, nondurable goods, and services.
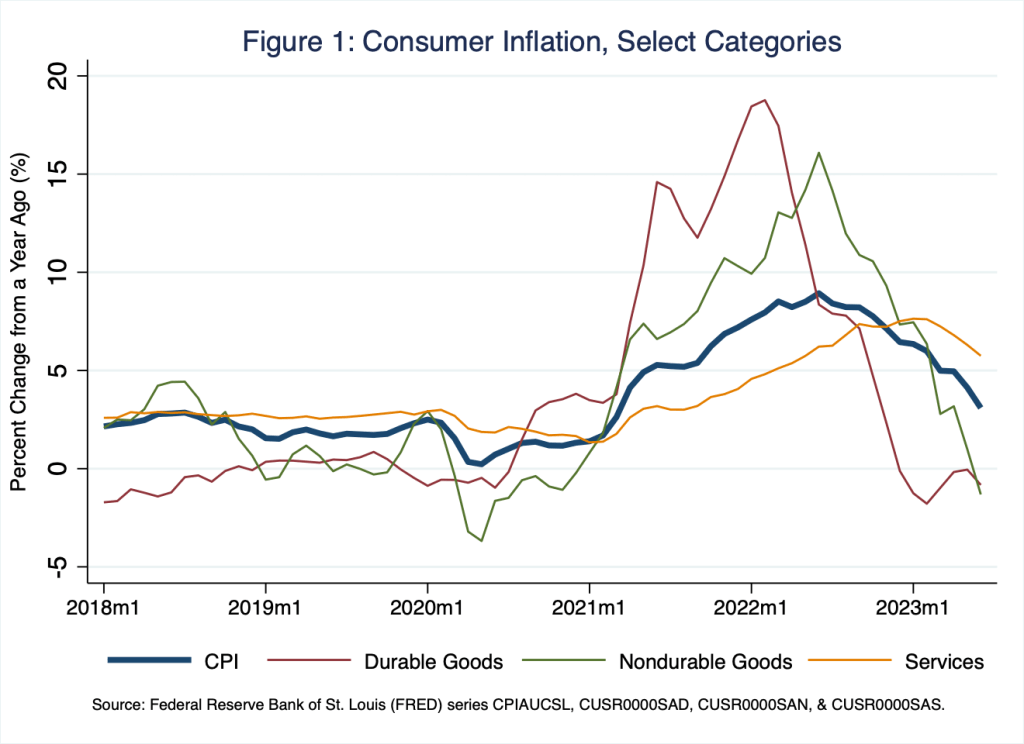
According to Figure 1, consumer-price inflation peaked at 8.9 percent in June 2022; it fell to 3.1 percent in June 2023. Meanwhile, growth in the average price levels of durable goods and nondurable goods peaked at 18.8 percent (February, 2022) and 16.1 percent (June 2022), respectively. In any case, core inflation, which I do not illustrate and from which we exclude volatile food and energy components, remains elevated at 4.9 percent (June 2023). We are not out of the woods yet.
In prior blogposts, including, for example, Exit Velocity, I offered a rather conventional, if somewhat monetarist, interpretation of these events: inflation is ultimately a monetary phenomenon, the outcome of too much money chasing too few goods. Because, as the quantity theory instructs, 


Or not.
Amid the seemingly persistent inflation of the last two years, a competing theory of the price level—“theory” may be a bit charitable—has emerged: enter, greedflation. According to the theory, imperfectly competitive firms—and to be fair, there are many; perfect competition is the exception not the rule—have increased their prices at a rate faster than the rate that firms’ costs of production have increased. Greedflation posits that this ostensibly opportunistic behavior by imperfectly competitive firms is the source of our unwanted inflation. To understand and assess this argument, let us begin by thinking about how an imperfectly competitive firm sets its price.
By definition, an imperfectly competitive firm—think, a profit-maximizing monopolist, for example—is a price maker, as opposed to a (perfectly competitive) price taker. Thus, by definition, an imperfectly competitive firm exercises its market power to set its price, which the firm does by setting the (marginal) revenue the firm generates from producing the good or service equal to the (marginal) cost the firm incurs by producing the good or service. To do otherwise would not be to maximize profit: if marginal revenue is greater [less] than marginal cost, the firm should produce more [less] to maximize its profit. Because an imperfectly competitive firm faces a downward-sloping demand curve—the firm’s price falls as the firm’s output increases; perfectly competitive farmers, say, don’t have this problem—marginal revenue is less than price. Thus, an imperfectly competitive firm necessarily sets a price that is greater than marginal cost.
Economists refer to the relationship between the price of the good or service and the marginal cost of producing the good or service as the markup, 


Because we define the markup, 


Finally, because 

For reasons of arithmetic, not economics, the latter expression implies the growth rate of the firm’s price,

where we read “


Although the markup is devilishly difficult to measure, mostly because a concrete measure of marginal cost is not available, according to a recent study published by the Federal Reserve Bank of Kansas City, average markup growth across all U.S. firms in the bank’s dataset has increased since the pandemic. The pattern is visible in Chart 1, which I reproduce from the recent study.
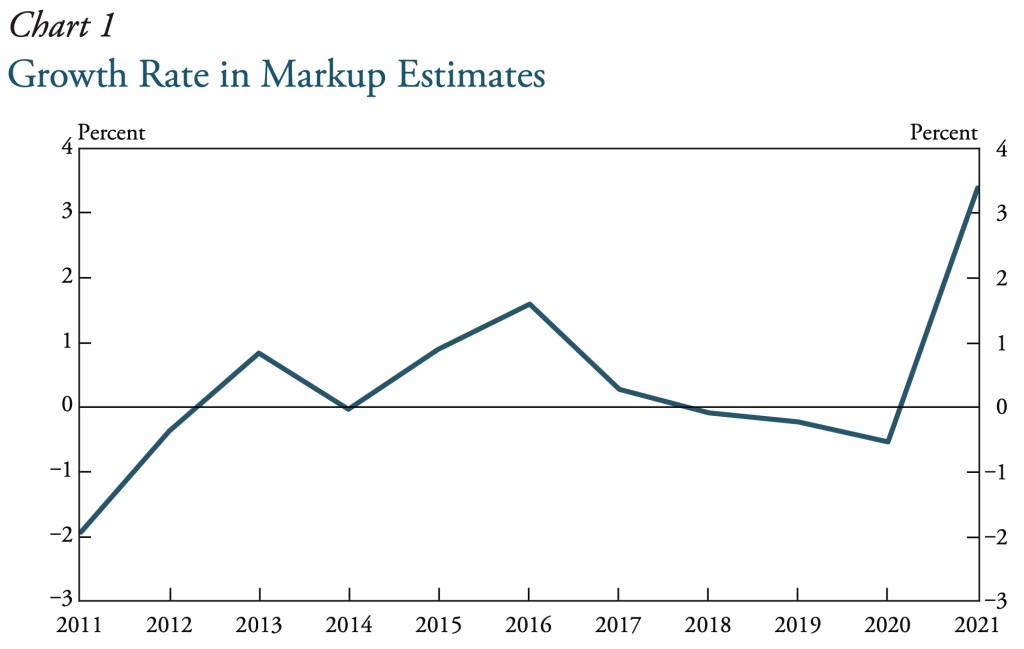
According to Chart 1, average markup growth increased by 3.4 percent in 2021, a time when inflation measured by the Fed’s preferred personal consumption expenditures index increased by 5.8 percent. Thus, a simple—and very likely too simple—interpretation of Chart 1 is the markup explains more than half the inflation in 2021. Greedflation is having its day.
Maybe, but let’s take a step back.
We could explain a rise in markup a few ways. First, competitive forces could weaken, enabling firms to choose higher prices, all else equal. In this way, prices rise, marginal costs remain fixed, and the markup rises. Second, aggregate-demand forces could strengthen, raising the demand for the goods and services of imperfectly competitive firms, all else equal. In this way, prices rise (because marginal revenues rise), marginal costs remain fixed (for simplicity), and the markup rises. And third, forces of innovation enhance production processes, reducing marginal costs, all else equal. In this way, prices remain constant, because passthrough from marginal costs to prices is imperfect, marginal costs fall, and the markup rises.
In principle, only the first way I explain a rise in the markup is consistent with the greedflation theory. And that description requires nothing short of a conspiracy: to wit, on average, imperfectly competitive firms suddenly and simultaneously choose to somehow weaken competitive pressures in their industry such that markups increase. And let us not forget, in 2021, some of the greatest average price level pressures existed in markets, such as those for used cars, oil, and consumer durable goods, where sudden and simultaneous changes in competitive pressures would have been impossible: a seller of a used car is hardly a price maker.
The second way I explain a rise in the markup amounts to imperfectly competitive firms availing themselves of their existing market power to raise prices when demand increases; this is not, in my view, a greedflation story strictly speaking: prices must rise when demand increases; how better to allocate resources? Nevertheless, the evidence for such a relationship between firm-specific demand and markup is weak (Federal Reserve Bank of Kansas City 2023). And in any case, there is the matter of timing. In the recent study published by the Federal Reserve Bank of Kansas City, the authors note:
The timing of markup growth in 2021, as well as earlier in the pandemic, does not line up neatly with the spike in inflation during the second half of 2021. Instead, the largest growth in markups occurred in 2020 and the first quarter of 2021; in the second half of 2021, markups actually declined. Therefore, inflation cannot be explained by a persistent increase in [firms’] market power after the pandemic.
Federal Reserve Bank of Kansas City (2023, p. 24)
To be sure, over longer stretches of time, during which we may abstract from high-frequency timing issues, price pressures 
Finally, the third way I explain a rise in the markup is consistent with falling, not rising, prices.
But if the greedflation theory is, as the Economist magazine recently put the matter, “nonsense,” why did average markup growth increase by 3.4 percent in 2021 as Chart 1 illustrates? According to the Federal Reserve Bank of Kansas City (2023), average markup growth increased because firms expected increases in their production costs. Essentially, amid supply-chain troubles and extraordinary increases in some production costs, firms anticipated more increases in production costs were on their way and, thus, firms smoothed future price increases accordingly. This is to say, firms raised their prices in anticipation of rising marginal costs. To some readers, raising the markup in anticipation of higher marginal costs may be greed by another name. However, to economists, pricing in expectations is an attribute of an efficient market; firms that do otherwise make forecastable (pricing) errors, the very definition of irrational behavior.
Perhaps the greedflation theory is least compelling to me because it seems an unnecessary stretch. There is no shortage of reasonable explanations for the sources of our currently high rates of inflation. Since the pandemic, fiscal and monetary policies have been extraordinarily loose and very likely overdone. Conventional theories of the price level clearly point to plausible causes. For example, Keynesian theories point to fiscal stimuli in excess of full-employment levels; while monetarist theories point to the extraordinary growth in the supply of money and declines in the demand for money.
Most importantly, adherence to a theory of the price level—greedflation, Keynesianism, monetarism, and so on—informs the policies we implement to achieve low and stable inflation. This is to say, theories have consequences. If we reason corporate greed is the source of unwanted inflation, then we implement policies to reduce inflation that target firm structure and conduct; antitrust legislation and wage-and-price controls are the policy instruments of choice in this case. Whereas, if we reason loose fiscal and monetary policies are the sources of unwanted inflation, then we implement policies to reduce inflation that target aggregate demand; spending, taxes, the federal budget, the money supply, and real interest rates are the instruments of choice in this case. In my view, we most effectively reduce unwanted rates of inflation by framing unwanted inflation as an outcome of loose fiscal and monetary policies. Greedflation seems to me a distraction, and a potentially costly one at that.
References
Conlon, Christopher, Nathan H. Miller, Tsolmon Otgon, and Yi Yao. 2023. “Rising Markups, Rising Prices?” AEA Papers and Proceedings, 113: 279-83.
Glover, Andrew, José Mustre-del-Río, and Alice von Ende-Becker. 2023. “How Much Have Record Corporate Profits Contributed to Recent Inflation?” Federal Reserve Bank of Kansas City Economic Review, First Quarter, 23-35.
