
![]() This blog post accompanies the final, regularly scheduled spring-2020 SDPR Morning Macro segment, which airs Monday, April 27. This segment will precede a related noon-hour event, “Money Matters: Macroeconomic Policy in a Pandemic and What It Means for Main Street,” hosted by the Rotary Club of Sioux Falls. The club’s Treasurer, Jason Herrboldt (Market President for First Bank & Trust in Sioux Falls), will host SCHOOLED’s J. Santos in Zoom space to discuss U.S. macroeconomic policy—with particular attention to Federal Reserve monetary policy—in the wake of the novel coronavirus. The event, part of the club’s spring-2020 speakers series, will be broadcast (Facebook) live and recorded on Monday, April 27 at noon (CST).
This blog post accompanies the final, regularly scheduled spring-2020 SDPR Morning Macro segment, which airs Monday, April 27. This segment will precede a related noon-hour event, “Money Matters: Macroeconomic Policy in a Pandemic and What It Means for Main Street,” hosted by the Rotary Club of Sioux Falls. The club’s Treasurer, Jason Herrboldt (Market President for First Bank & Trust in Sioux Falls), will host SCHOOLED’s J. Santos in Zoom space to discuss U.S. macroeconomic policy—with particular attention to Federal Reserve monetary policy—in the wake of the novel coronavirus. The event, part of the club’s spring-2020 speakers series, will be broadcast (Facebook) live and recorded on Monday, April 27 at noon (CST).
In the last five weeks, the Federal Reserve—the U.S. lender of last resort—has responded forcefully and unprecedentedly to the macroeconomic fallout of the novel coronavirus. And no wonder: a severe economic contraction—by all reasonable accounts a recession deeper than the Great Recession a decade ago—is imminent. (For more on why economists reason a severe economic contraction is imminent, see the Morning Macro segment, “Sahm Trouble Ahead.”) Several of the Federal Reserve’s responses thus far have been unconventional, in some cases wildly so. The policy objective is clear: keep households, firms, and municipalities afloat through the contraction. Far less clear is how the central bank’s actions are reshaping its role in and relationship to the macroeconomy and whether the central bank’s current unconventional responses are appropriate in any case. This lack of clarity is unacceptable.
Our story begins five weeks ago, on an evening in March.
Initially, the Federal Reserve responded to the current crisis rather conventionally, if somewhat dramatically. Following an emergency meeting on Sunday evening, March 15th—the second unscheduled meeting in as many weeks—the Federal Reserve eased credit conditions in the federal funds market, where the closely watched federal funds rate is determined. The Federal Open Market Committee (FOMC) lowered its target range for the federal funds rate to between 0.25 and 0.0 percent; the range had stood, since the unscheduled FOMC meeting on March 3rd, at between 1.25 and 1.00 percent. The relative magnitude of this response is evident in Figure 1, in which I illustrate the federal funds rate since the first week of January 2000.
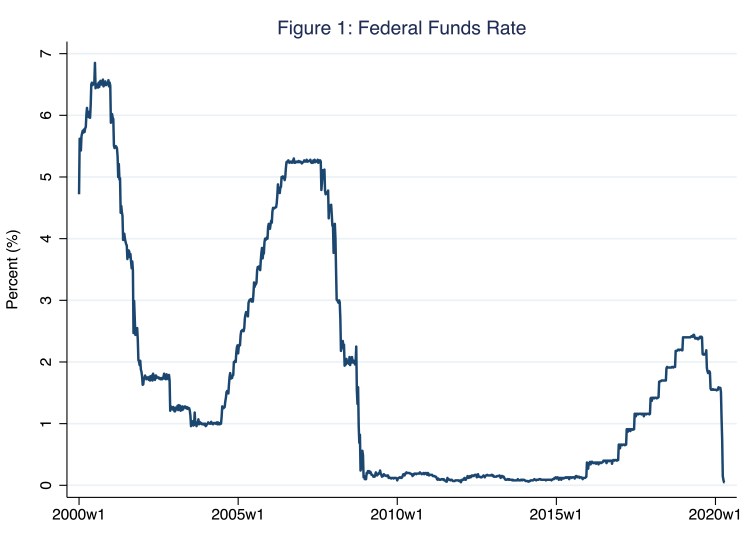
According to Figure 1, by Wednesday, April 8th, the federal funds rate registered (a very low) 0.05 percent; the rate now hovers just above the so-called zero lower bound, roughly where the rate hovered for years following the Great Recession.
Recall, the federal funds rate is the (interbank) rate that banks charge each other for bank reserves—inventories, essentially, that banks manage in order to generate earnings (by lending reserves to borrowers) and to maintain liquidity (by storing reserves for cash-seeking depositors). As Morning Macro devotes know well, the Federal Reserve rather precisely targets the federal funds rate; thus, at any moment, the rate reflects the so-called stance of monetary policy: expansionary—and a relatively low federal funds rate—if output is below potential or inflation is below the two-percent target rate; or contractionary—and a relatively high federal funds rate—if output is above potential or inflation is above the two-percent rate. The central bank’s dual (Congressional) mandate of maximum employment (and, thus, output at or very near its potential) and stable prices (and, thus, low and stable inflation) informs this tactical feature of monetary policy. (For more on the dual mandate, see the Morning Macro segment, “Mind the Gaps.”)
All very conventional, I know.
Since its move on March 15th to ease credit conditions in the federal funds market, the Federal Reserve has been anything but conventional; the term mind-blowing comes to mind. To appreciate the unconventional nature of recent Federal Reserve monetary policy, and what the central bank seeks to achieve by implementing this policy, recall the defining feature of a central bank: it issues the economy’s monetary base. In the United States, the monetary base primarily includes Federal Reserve notes circulating outside the banking system as currency and bank reserves in the physical or virtual vaults of banks; the vast majority of bank reserves are in virtual vaults.
What is perhaps most difficult to appreciate about the U.S. monetary base is that it is a liability of the Federal Reserve; recall, a liability is owed, whereas an asset is owned. Meanwhile, to everyone else—including households, firms, governments (ours and those of other countries), and even other central banks—the U.S. monetary base is an asset: households own their U.S. currency; banks own their reserves, and so forth. Consider, for example, the simplified Federal Reserve balance sheet that I depict in Illustration 1, where the monetary base appears in red and blue fonts on the right side of the central bank’s balance sheet. (In similar fashion, Japan’s [yen-denominated] monetary base is a liability of the Bank of Japan, the United Kingdom’s [sterling-denominated] monetary base is a liability of the Bank of England, and so on.)
Illustration 1: A Simplified Federal Reserve System Balance Sheet
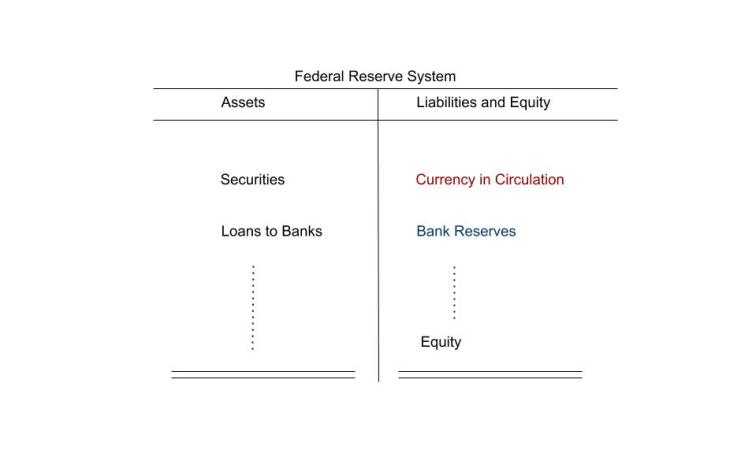
Unlike the accounts that comprise the monetary base, the remaining accounts in Illustration 1 are entirely relatable: securities—think IOUs from the Treasury (which is distinct from the Federal Reserve)—and loans to banks—think, accounts receivable—are Federal Reserve assets; and Federal Reserve equity, paid in by member commercial banks, is a source of funds. Households, for example, would similarly place securities and loans to others in asset accounts; and household equity is a source of household funding. Because the accounts on each side of a balance sheet must sum to a common amount, we can understand quite a bit about monetary policy—conventional or otherwise—by thinking about monetary-policy operations in the context of Illustration 1. Suppose, for example, the Federal Reserve endeavors to increase bank reserves (in order to reduce the federal funds rate, say, as the central bank did in mid March of this year); to do so, the Federal Reserve could purchase government securities, thereby increasing the liability account, Bank Reserves, and increasing the asset account, Securities, by a common amount. This is an example of a so-called open-market operation.
Put differently, then, expansionary monetary policy implies increasing the size of the balance sheet of the central bank. This is because expansionary operations generally increase bank reserves and a corresponding asset, such as securities. Over time, operations associated with conventional monetary policies change the monetary base relatively little—just enough to keep the federal funds rate on target, essentially; meanwhile, operations associated with unconventional monetary policies potentially change the monetary base dramatically. In Figure 2, I illustrate the U.S. monetary base from January 2000.
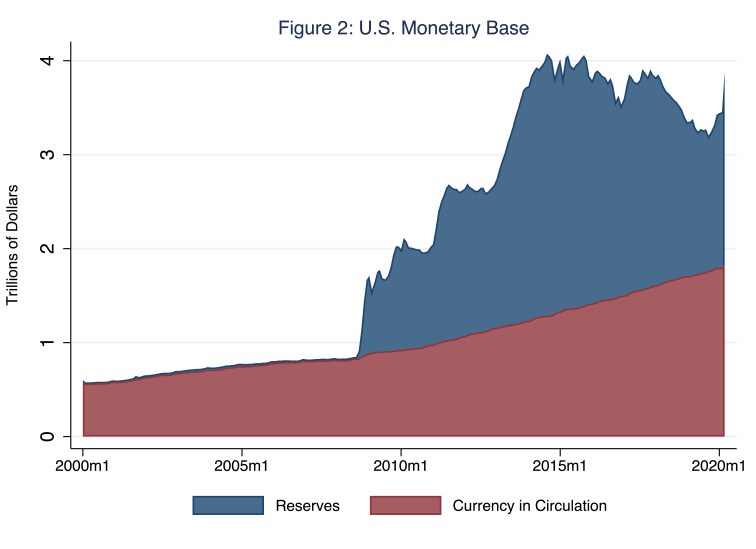
Look closely at Figure 2: reserves, in blue, are barely visible before the Great Recession and the concomitant and unprecedented rise in bank reserves that dwarf earlier observations. Meanwhile, the rise in currency in circulation is a gradual, largely uneventful process driven by our steady demand for cash, literally. In 2007, just prior to the Great Recession, the monetary base totaled $837 billion; by 2015, the base totaled $4.1 trillion. In Figure 3, I illustrate only bank reserves, the blue area in Figure 2.
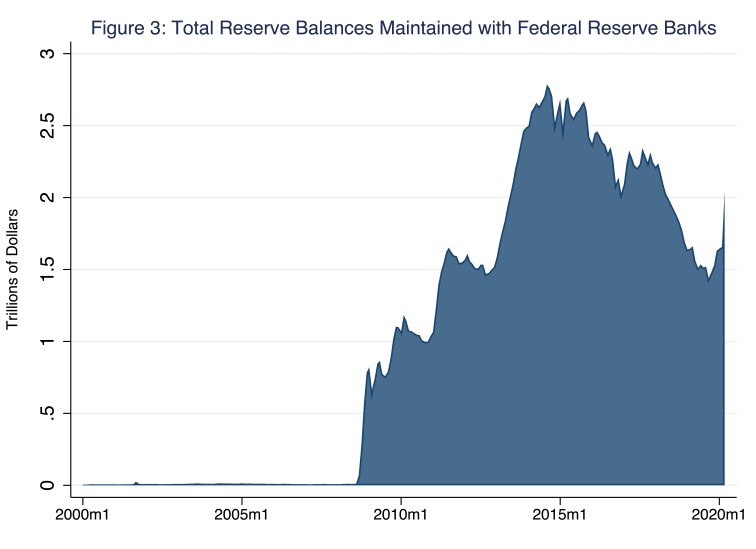
Before the Great Recession, bank reserves totaled on the order of $10 billion, two orders of magnitude less than bank reserves total today. (The rise in bank reserves around September 11, 2001, when the Federal Reserve aggressively sought to shore up liquidity in the banking system, is barely visible in Figure 3.) Just prior to the Great Recession, the U.S. monetary base measured roughly 6 percent of GDP; as of the fourth quarter of 2019, the base measured roughly 15 percent of GDP, having fallen from a peak of 22 percent in 2015. I illustrate this pattern in Figure 4.
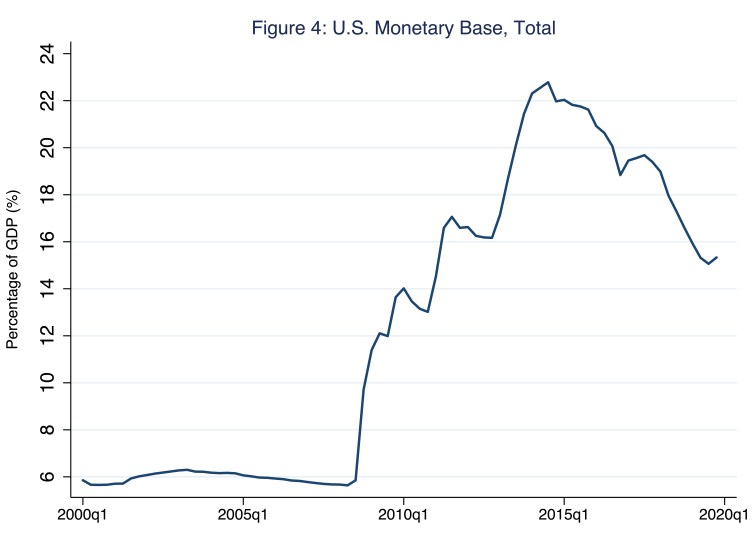
As you may have surmised, the Great Recession ushered in unconventional monetary policy; and we are at it again: as a share of the U.S. economy, the monetary base is well on its way to measuring more than 25 percent of GDP.
Unconventional is the new conventional.
Unconventional monetary policy is often theoretically founded on the notion that markets—in this case, credit markets—are in some ways segmented: to take a simple example, suppose the short-term and long-term U.S. Treasury markets are segmented; this means an excess supply of loanable funds in the secondary market for short-term U.S. Treasury securities, say, does not flow to the secondary market for long-term U.S. Treasury securities where suppose there is an excess demand for loanable funds. In such cases, secondary loanable-funds markets, such as the U.S. Treasury market in my example or a mortgage-securities market, may require either so-called credit easing or quantitative easing—a difference in terms without a distinction, some may argue. To be sure, both terms refer essentially to large-scale open market purchases of securities. When the central bank conducts those operations in order to target markets for specific securities (which the central bank books as an asset), the term credit easing appropriately describes the operations; whereas when the central bank conducts those operations in order to target the quantity of bank reserves (which the central bank books as a liability), the term quantitative easing appropriately describes the operations. Or, put another way, credit easing intentionally alters the composition of the central bank’s assets; quantitative easing intentionally alters the amount of bank reserves.
Thus, although interest rates in some credit markets, such as the federal funds market or the short-term U.S. Treasury market, may be relatively low, in order to function properly (albeit with the support of the central bank), some markets may require a market maker or, in effect, lender of last resort, a counter-party capable of buying a security when few others will. Such interventions, taken on a large scale, characterize unconventional monetary policy, which intentionally alters the composition (credit easing) and increases the size (quantitative easing) of the central bank’s balance sheet. For example, from 2003 to 2007, a period of conventional monetary policy, U.S. Treasury securities comprised, on average, 89 percent of the assets on the balance sheet of the central bank. In contrast, from 2008 to 2012, as the central bank sought to unclog specific credit markets (other than U.S. Treasury markets) and, consequently, accumulated securities traded in those markets, the comparable figure registered 46 percent (including a low of 21 percent reached in the final weeks of 2008). Since then, as the central bank alternated between credit easing and quantitative easing, the comparable figure has registered, on average, 55 percent. This variation in the central bank’s holdings of U.S. Treasury securities is indirectly and, so, interestingly evident in Figure 5, in which I illustrate the shares of total public debt outstanding—necessarily in the form of U.S. Treasury securities—held in the last two decades by the public (domestic and foreign), Federal Reserve Banks, and other U.S. government agencies and trusts.
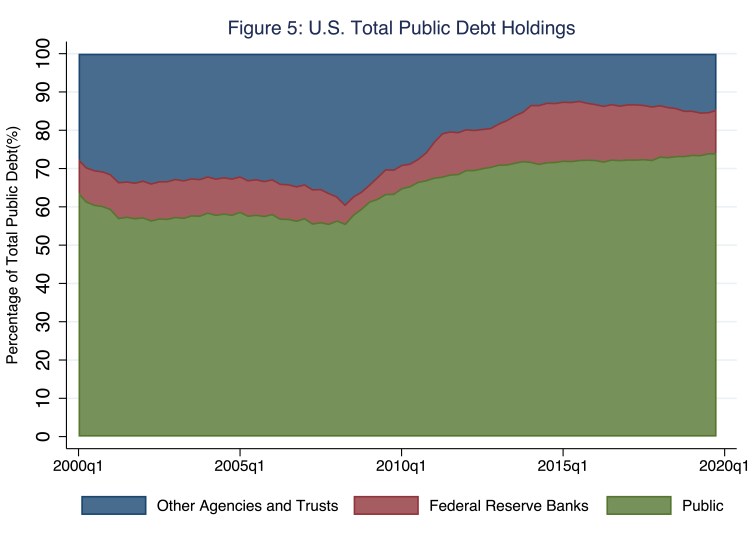
According to Figure 5, the share of total public debt outstanding held by the Federal Reserve remained relatively constant at roughly 9 percent before the Great Recession (when the Federal Reserve engaged in neither credit nor quantitative easing), fell to roughly 4 percent in the first quarter of 2009 (as the Federal Reserve favored credit over quantitative easing), and rose thereafter, reaching 15 percent in the third quarter of 2014, as the Federal Reserve favored quantitative over credit easing. Figure 5 also reveals an often overlooked fact: the Federal Reserve does not hold the majority of U.S. Treasury securities outstanding, at least not yet anyway. Finally, in addition to credit and quantitative easing, unconventional monetary policy may include primary lending as a last resort to entities other than depository institutions, for which conventional, so-called discount lending is reserved; a notable example here is the Federal Reserve’s loans to insurer, AIG, in the wake of the Great Recession.
We live in unusual and exigent times.
Section 13(3) of the Federal Reserve Act, as amended by Congress during the Great Depression, affords the central bank emergency lending authority in “unusual and exigent circumstances” to “any individual, partnership, or corporation” (Baker 2012, 87). Prior to the current crisis, the Federal Reserve invoked this authority twice: in the aftermaths of the Great Depression and the Great Recession. Section 13(3) legalizes unconventional monetary policy.
The Dodd-Frank Wall Street Reform and Consumer Protection Act (2010) modified Section 13(3) authority; most notably for the purpose of this blog post, the authority must now function as a lending facility available to borrowers based on broadly defined eligibility criteria—so the AIG loan would not be legal today—and be approved by the U.S. Treasury (Baker 2012, 88-89). In any case, loans must be sufficiently collateralized so as to protect the Federal Reserve and, ultimately, U.S. tax payers from losses.
The Federal Reserve in concert with the U.S. Treasury has once again invoked Section 13(3) authority. Consequently, in the last five weeks, unconventional monetary policy has taken several paths, some well worn (credit and quantitative easing, for example), others entirely uncharted (Main Street Loan and Municipal Liquidity facilities, for example). In Table 1, I identify these unconventional monetary policy tools, which the Federal Reserve has either reintroduced or introduced in the last five weeks; these programs collectively represent $2.3 trillion of lending capacity.
| Policy Tool | Description |
|---|---|
| Credit / Quantitative Easing | Purchase Treasury and agency MBS |
| Commercial Paper Funding Facility* | Purchase eligible commercial paper |
| Primary Dealer Credit Facility | Lend to primary dealers |
| Money Market Mutual Fund Liquidity Facility* | Lend to money-market mutual funds |
| Primary Corporate Credit Facility* | Purchase eligible corporate bonds, primary market |
| Secondary Corporate Credit Facility* | Purchase eligible corporate bonds, secondary market |
| Term Asset-Backed Securities Loan Facility* | Lend against asset-backed securities |
| Main Street Loan Facilities* | Lend to small and mid-sized businesses |
| Municipal Liquidity Facility* | Purchase eligible short-term municipal notes |
| Paycheck Protection Liquidity Facility | Lend against Paycheck Protection Program-loans |
| Swap Lines and Repurchase Facility | Lend to foreign central banks |
| Asterisk denotes U.S. Treasury capitalization. Source: Wells Fargo Securities. | |
Note in Table 1 the use of Section 13(3) designated facilities for all lending operations, in keeping with the Dodd-Frank Act. Perhaps the most innovative feature of several of these facilities is the role the U.S. Treasury plays in capitalizing them; these facilities are indicated with an asterisk. Generally speaking, a facility is a so-called special purpose vehicle, an intermediary in effect, that sources funds from the facility’s investors and, in turn, uses these funds to underwrite loans according to the protocols of the particular facility. The investors in the facilities identified in Table 1 are the Federal Reserve and, in those cases indicated with an asterisk, the U.S. Treasury. Take, for example, the Municipal Liquidity Facility. The U.S. Treasury will invest $35 billion of equity in this facility; the Federal Reserve will invest the remaining sources of funds, estimated to reach roughly $500 billion. Thus, in this case, the U.S. Treasury is positioned to absorb, as an equity investor in the facility, the first $35 billion of losses, were these losses to materialize. The special purpose vehicle is an accounting device that cordons off, as it were, these facilities from conventional monetary policy operations. Nevertheless, Federal Reserve investments in these facilities expand the central bank’s balance sheet: the central bank’s assets increase by the central bank’s stake in the facility; and the central bank’s liabilities increase by the amount of bank reserves the central bank creates in order to invest its stake in the facility.
So how has the monetary base fared in the last five weeks? It’s grown, a lot.
As a consequence of implementing the tools identified in Table 1, the monetary base and, specifically, bank reserves have increased markedly. In Figure 5, I illustrate the principal factors that have grown reserve balances in this way; these factors have necessarily manifested as assets recently accumulated—since the third week of January 2020 in the case of Figure 5—on the central bank’s balance sheet.
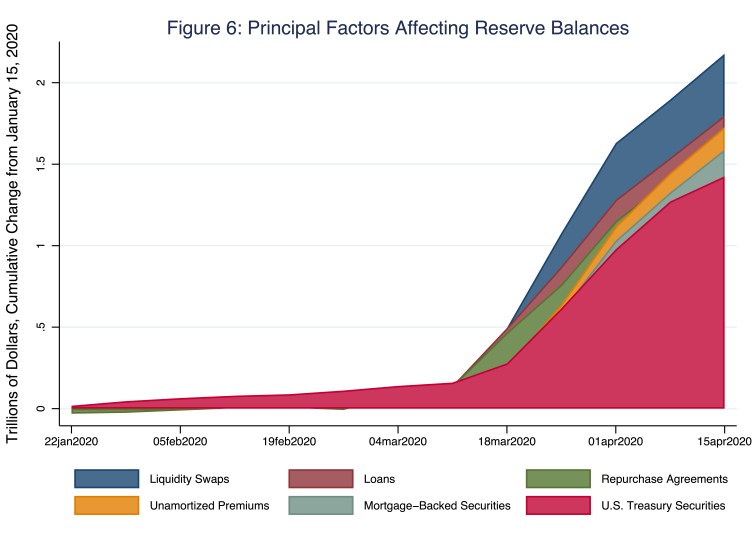
According to Figure 5, since the third week of January 2020, the balance sheet of the Federal Reserve has increased by over $2 trillion. Much of this increase, depicted in red in Figure 5, has consisted of U.S. Treasury securities. Though more recently, this increase has also consisted of, for example, loans and mortgage-backed securities acquired via the various facilities identified in Table 1 and liquidity swaps to other central banks. These facilities have just gotten started. The monetary base has much more to grow.
Inflation is always and everywhere a monetary phenomenon, just not right now.
Although the Federal Reserve, like all central banks, directly controls its monetary base as opposed to its money stock, long-run changes in the monetary base drive long-run changes in the money stock. Recall, the U.S. money stock consists of Federal Reserve notes circulating as currency—the currency portion of the monetary base—and bank-account deposits, both of which satisfy the definition of money: a generally accepted means of payment for goods, services, and debts. (For more on the relationship between the monetary base and the money supply, see the Morning Macro segment, “Fed Up.”) In Figure 7, I illustrate the growth in the money stock, which I measure in terms of M1 and M2.
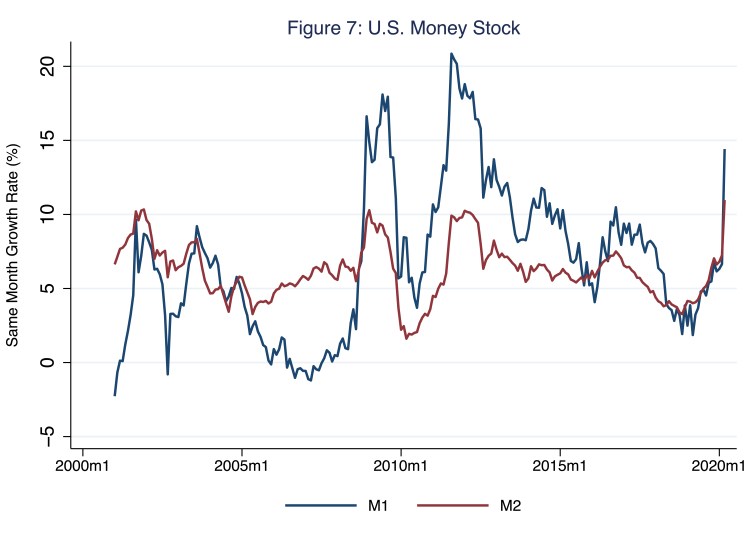
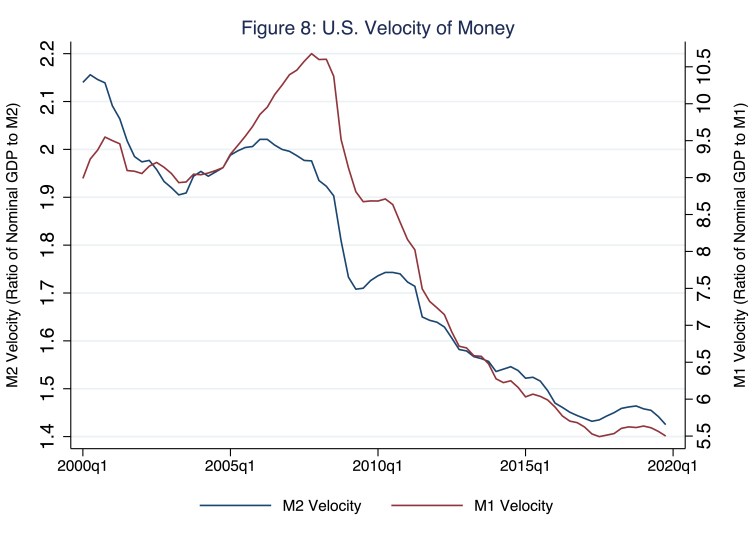
According to Figure 7, in the last several weeks, the growth in the money stock, defined as either M1 or M2, has been substantial, though not unprecedented. In March 2020, M1 and M2 grew at annualized rates of 14 and 11 percent, respectively; this substantial rise is no doubt a consequence of the similarly substantial rise in the monetary base. And, as Milton Friedman often reminded us, inflation is a monetary phenomenon spurred by increases in the money stock, all else equal. Though, at the moment, all else is not equal. The velocity of money—how many times on average the money supply changes hands in the purchase of GDP—has fallen reliably since the Great Recession; put differently, the demand to hold (and, perhaps, hoard) money has risen reliably. In Figure 8, I illustrate the income velocities of M1 (right scale) and M2 (left scale).
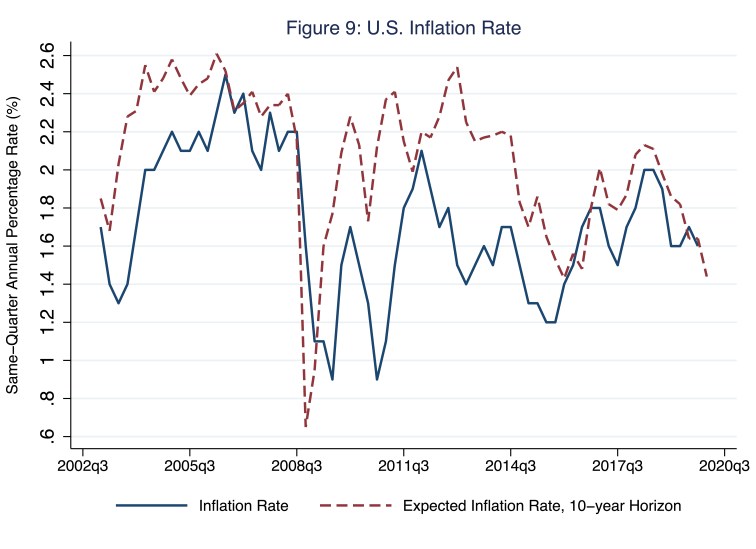
The demand to hold money mitigates the otherwise inflationary effects of increases in the money stock. Thus, while the monetary base and, in turn, the money stock have grown considerably since the Great Recession and, more to the point, since the emergency meeting on Sunday evening, March 15th, actual inflation and expected inflation have not budged; both remain well below the Federal Reserve’s target of 2 percent. In Figure 9, I illustrate these patterns.
So if maintaining low and stable inflation is not an immediate problem, then all is well with the current version of unconventional monetary policy. Yes?
Not quite.
Several of the initiatives I list in Table 1 require the Federal Reserve to lend directly or indirectly to households, firms, and municipalities not to unstick specific credit markets (credit easing) or to achieve a particular operating target in the market for bank reserves (quantitative easing), but rather to keep households, firms, and municipalities afloat during the impending economic contraction—a sensible goal, just not one with which the Federal Reserve, or any other central bank, should be tasked. The Federal Reserve is not budget constrained; it could create an infinite amount of bank reserves and, thus, it could underwrite an infinite amount of loans. And this is precisely why we should not call this monetary capacity into service. The potential to monetize private debt, absent a credible commitment to do otherwise, places the central bank’s long-run credibility to maintain low and stable inflation at stake.
But what other option do we have? Well, we could have commercial—and, importantly, community—banks lend to households, firms, and municipalities; and, in turn, have a special purpose vehicle buy these loans from commercial banks. Importantly, the special purpose vehicle would be funded by private investors (as opposed to the Federal Reserve) and the Treasury, which could capitalize the vehicle and, thus, absorb losses incurred due to loan defaults or intentional loan forgiveness; the share of Treasury capitalization would effectively determine the amount of risk to which the vehicle’s private investors would be exposed. This option would keep households, firms, and municipalities afloat during the impending economic contraction subject essentially to the budget constraint imposed by the Congressional appropriations process. Meanwhile, this option would preserve the central bank’s role as an independent and, thus, credible steward of the long-term purchasing power of the money stock.
References
Baker, Colleen. 2012. “The Federal Reserve as Last Resort,” University of Michigan Journal of Law Reform 461:69-133.

2 thoughts on “last resort”