
This blog post accompanies the SDPB Monday Macro segment that airs on Monday, April 3, 2023. Click to here to listen to the segment, which begins at minute 14:15. For more macroeconomic analysis, follow J. M. Santos on Twitter @NSMEdirector.
On Tuesday, March 28th, when Michael Barr, the Federal Reserve’s vice chairman for bank supervision, testified before the Senate on the failure of Silicon Valley Bank (SVB) and Signature Bank and on the liquidity crisis in the banking sector more generally, he noted in his prepared remarks, “SVB failed because the bank’s management did not effectively manage its interest-rate and liquidity risk, and the bank then suffered a devastating and unexpected run by its uninsured depositors.” Barr rightly emphasized interest-rate and liquidity risk, as opposed to, say, default risk. This is to say, the financial fragilities that have everyone talking are caused not by borrowers who have failed to pay their debts to banks, but rather by a fundamental vulnerability in banking, a consequence of what economists refer to as maturity transformation: because banks borrow money from savers who generally prefer ready and easy access to their savings—savers prefer to lend their money to banks for relatively short periods of time—and banks lend that money to borrowers who generally prefer to pay back their loans in installments over relatively long periods of time, banks are vulnerable to the (liquidity) risk that savers withdraw their savings en masse, often because savers could find more-lucrative or safer deals elsewhere. In an environment of sharply rising interest rates, precisely the environment banks find themselves in now, this liquidity risk is very real.
To understand how the liquidity crisis, and the takedown of SVB in particular, unfolded and why Vice Chair Barr rightly attributed these events to a crisis of bank management, consider how credit flows through the economy. Credit is allocated in the financial system, where, by definition, individuals, firms, and governments with a surplus of funds—think, lenders, for example—transfer these funds to individuals, firms, and governments with a shortage of funds—think, borrowers, for example. Conceptually speaking, economists divide the financial system into two broad sectors: namely, financial markets and financial intermediaries. In financial markets, the transfer of funds is direct: an individual, firm, or government with a shortage of funds sells a security—a (direct) claim on the earnings or assets of the seller—to an individual, firm, or government with a surplus of funds. So, for example, stock and bond markets are financial markets, where equity securities (stocks) and debt securities (bonds) trade. In contrast, financial intermediaries are agents who administer the transfer of funds through the financial system; thus, in this way, the intermediated transfer of funds (from the saver to the ultimate borrower, say) is indirect. So, for example, depository institutions—banks, for the most part—are financial intermediaries.
Throughout the world, most credit is intermediated through the financial system for several reasons. (For more on these reasons, and why the trend away from smaller, so-called community banks could constrain credit to some borrowers, see Monday Macro segment, Extra Credit). Perhaps the most fundamental reason is that financial intermediaries in general, and banks in particular, transform short-term maturity bank accounts—think, checking accounts and other such sources of short-term funding—into long-term maturity loans—think, mortgages and other such long-term uses of short-term funding. This process of maturity transformation in banking is often referred to colloquially as borrowing short and lending long.
By effectively transforming maturities this way, financial intermediaries bridge a time-to-maturity gap that would otherwise impede the provision of credit, because most savers prefer ready access to their savings; they prefer liquidity to illiquidity. Or put another way, most savers would pass on the opportunity to lend long instead of short. Thus, long-term maturity loans generally pay higher yields to maturity than short-term maturity loans do. More often than not, this pattern is evident in a so-called yield curve, which plots the relationship between yields to maturity on short-term bonds (like those that mature in, say, one year) and long-term bonds (like those that mature in, say, 10 or 30 years). A bond is a certificate of indebtedness, a so-called IOU, that a borrower sells to a saver; the saver buys the bond—think, lends funds to the borrower—in return for a yield to maturity. You can think of a checking account as functioning like a very short-term bond: both the checking account and the very short-term bond are relatively liquid vehicles a saver uses to save and have easy access to their money. In Figure 1, I illustrate a yield curve—or, more formally, a (maturity) term structure of interest rates—that plots the relationship between annual yields on three hypothetical bonds and their corresponding to 1-, 2-, and 3-year terms to maturity.
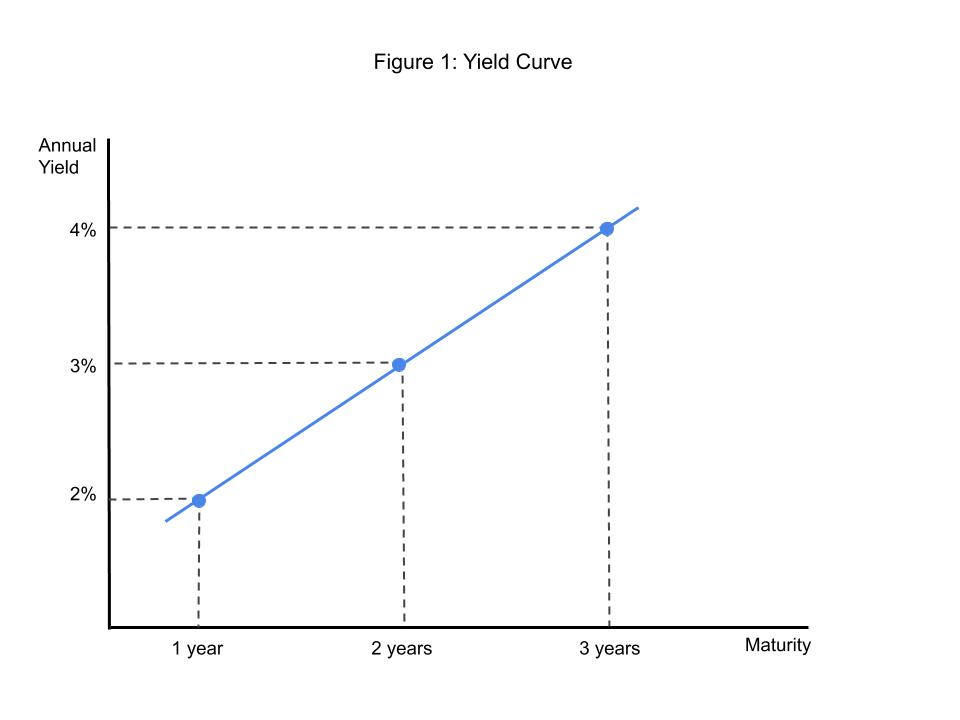
In the case I depict in Figure 1, the maturity of a bond is positively related to its annual yield to maturity—the annual interest the bond pays if you hold it to maturity. In Figure 1, a bond that matures in 1 year offers an annual yield to maturity of 2 percent, a bond that matures in 2 years offers an annual yield to maturity of 3 percent, and so on. In principle, the bonds we use to construct a yield curve are identical in every respect except term to maturity; this is to say, the bonds present identical default risk, tax exposure, and so forth. Thus, in principle, the yield curve reflects, all else equal, the relationship between the maturity of a bond and its annual yield. So, in terms of Figure 1, a bond that matures in, say, 3 years offers a higher annual yield than a bond that matures in, say, 2 years precisely because the 3-year bond matures and, thus, returns principal and interest to the saver one year later than the 2-year bond does. And all else equal, a saver prefers her money returned to her sooner rather than later.
The process of maturity transformation—borrowing short and lending long—generates profit for banks because the yield curve is generally positive. In the stylized case of Figure 1, a bank borrows at a 1-year maturity—and, thus, pays a 2-percent yield to maturity for doing so—and a bank lends at a 3-year maturity—and, thus, earns a 3-percent yield to maturity for doing so. The difference of 3 percent minus 2 percent is the so-called net-interest margin, a key driver of the income a bank generates for lending its depositors’ savings.
This business model exposes a bank to so-called interest-rate risk and, specifically, a sudden, large rise in interest rates. This is because when interest rates rise, a bank must increase the interest rate it pays to keep its necessarily short-term deposits, which depositors could otherwise withdraw; meanwhile, the bank cannot increase the interest rate it earns on its loans, because borrowers who took out those loans locked in a rate for a relatively long time. Put differently, when interest rates rise, the cost of a bank’s sources of funds generally rises while the return on a bank’s uses of funds generally does not: net interest margin falls.
Throughout the pandemic, two features of the banking system all but (wrongly) eliminated bankers’ and regulators’ concerns about interest-rate risk. First, because of pandemic-era fiscal stimulus—think, CARES Act and its stimulus payments, for example—household savings rose substantially; most of this savings took the form of checking-account deposits, or what economists refer to as demand deposits. In Figure 2, I illustrate demand deposits from a few years before the pandemic until now.
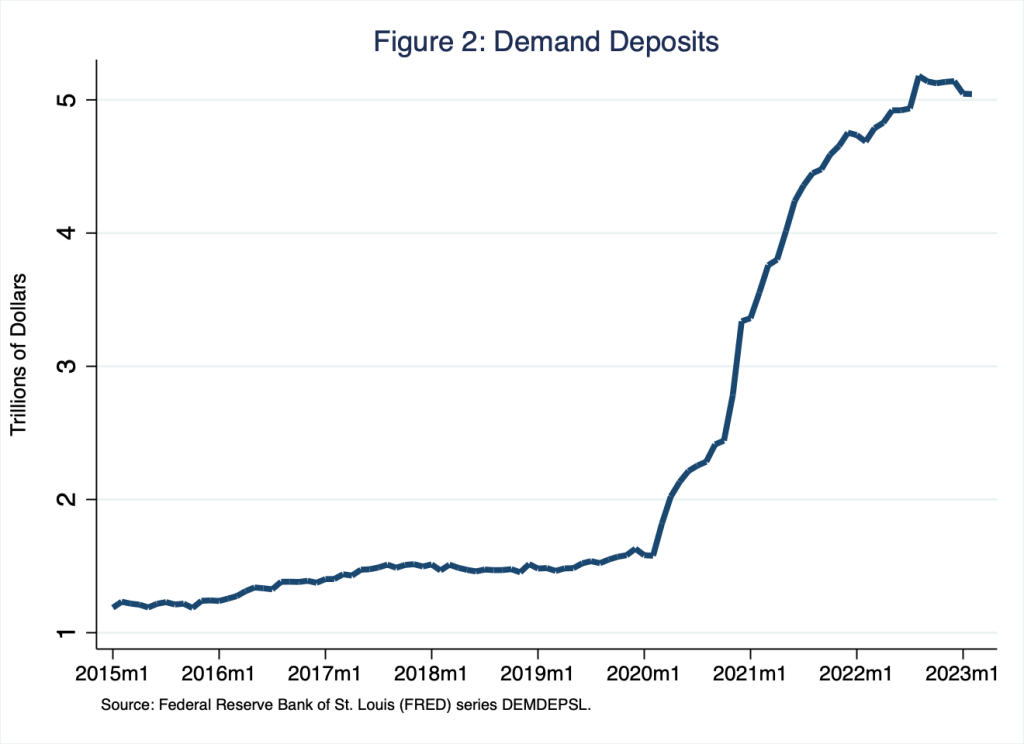
According to Figure 2, demand deposits rose from roughly $1.6 trillion in December 2019 to roughly $5 trillion in February 2023. Meanwhile, short-term maturity interest rates, including the interest rates banks paid on checking account balances, hovered near zero. Put differently, since the start of the pandemic, (short-term maturity) demand deposits have been abundant and, until recently, exceptionally cheap: thus, since the pandemic, the temptation for banks to borrow short has been great, until now.
As Schooled readers know well, since the pandemic, the rate of inflation has risen several percentage points above the rate of two percent the Federal Reserve prefers. In Figure 3, I illustrate the (same-month) annual percentage change in the consumer price index, which locally peaked at 8.9 percent in June 2022.
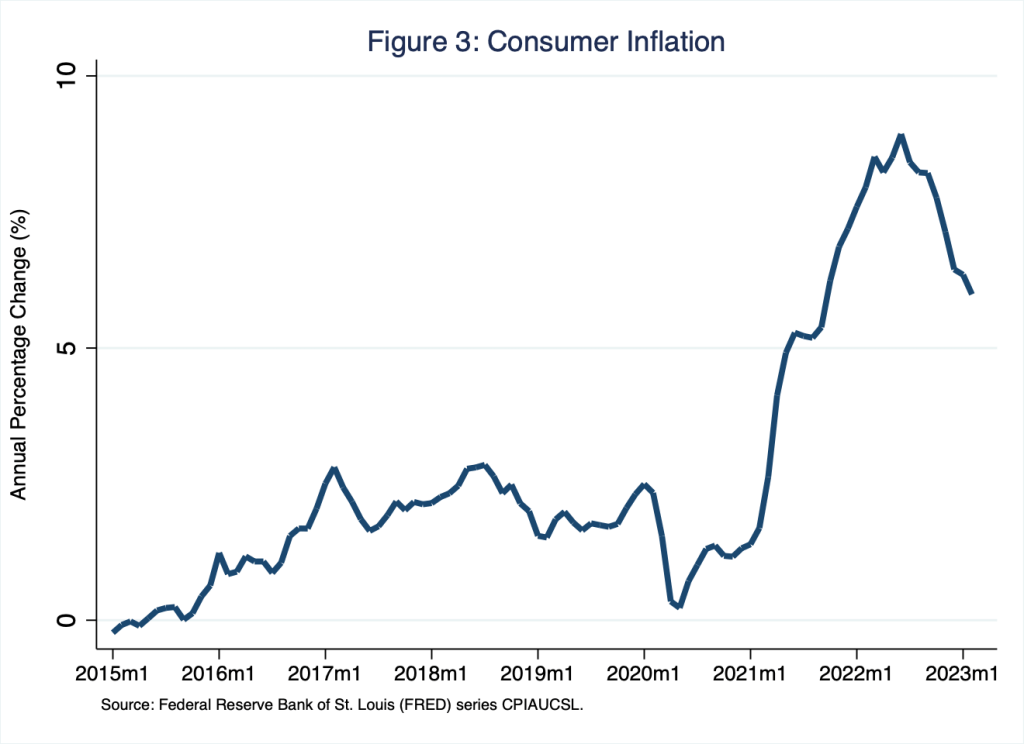
Consequently, the Federal Reserve has tightened monetary policy considerably; to do so, the Federal Open Market Committee has raised the target range for the federal funds rate from 0.00 to 0.25 percent in February 2022 to 4.75 to 5.00 percent now. In principle, tightening monetary policy in this way reduces—or, in the crude parlance of monetary theory, destroys—aggregate demand, lowering the rate of inflation (and the rates of output, income, and employment, but leave that aside for now). The federal funds rate is a rate banks charge each other for overnight loans of so-called reserves—think, cash in the vault. Thus, the fed funds rate is a short-term maturity interest rate. In the stylized context of Figure 1, the federal funds rate and its maturity are positioned around the bottom-left corner of the figure—where the maturity is short and the interest rate is low. In this way, we could think about the federal funds rate as a proxy for the rate banks must pay in a competitive market for (short-term maturity) deposits in order to retain those deposits.
Because the central bank has rather suddenly and significantly raised the fed funds rate, short-term maturity interest rates more generally have risen above long-term maturity interest rates: the yield curve has inverted. Put differently, the cost of a bank’s short-term sources of funds has risen above the return on a bank’s long-term uses of funds. I illustrate this pattern in Figure 4, in which I include the monthly average federal funds rate—think, proxy for the short-term rate a bank pays its savers for its sources of funds—and the 10-year maturity U.S. treasury bond rate—think, the long-term rate the bank earns on its borrowers’ uses of funds.
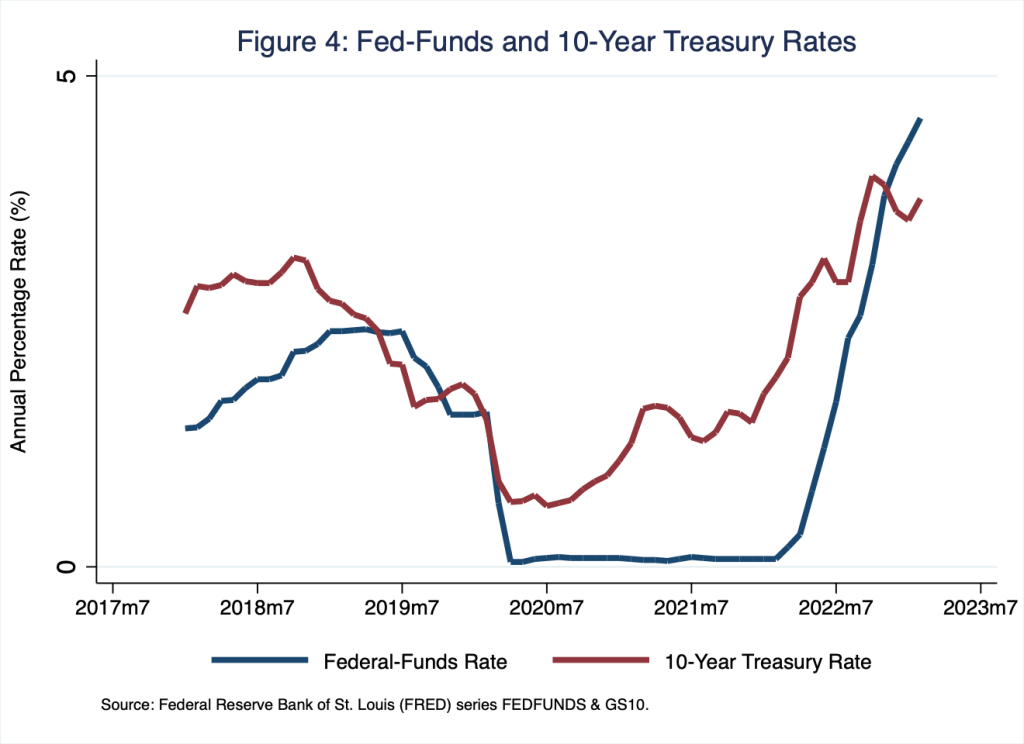
For much of the time series I depict in Figure 4, the yield to maturity on the long-term maturity bond issued by the US Treasury is above the short-term maturity federal funds rate—the red line is above the blue line. Put differently, then, for much of the time series I depict in Figure 4, the yield curve is positively sloped, driving the banking sector’s net interest margin in a positive direction. However, for the last several months (far-right side of Figure 4), this pattern has turned upside down—the blue line is above the red line: the yield curve is negatively sloped, driving the banking sector’s net interest margin in a negative direction.
Faced with this sudden yield-curve inversion, banks have two unpleasant choices: raise the rates banks pay on deposits to retain them, or accommodate deposit-withdrawal demands (by depositors who prefer to invest their savings elsewhere); the latter requires banks to drain their cash reserves, which conjures images of that iconic scene with Jimmy Stewart in It’s a Wonderful Life, what no banker or bank regulator wishes to experience. If the bank prefers not to drain reserves, or if the bank has no reserves to drain, the bank sells necessarily long-term maturity assets, such as 10-year or longer US Treasury bonds—the sorts of long-term maturity assets on which the bank earns interest income. Selling long-term maturity bonds incurs capital losses if, as is the case now, interest rates are higher today, when the bank sells the bond, than when the bank purchased the bond; bond yields and bond prices necessarily move in opposite directions. Because, by definition, capital losses erode capital, a bank suffering capital losses could find itself in a financial position whereby the market value of its assets is less than the market value of its liabilities, a case in which the market value of capital is negative and, thus, the bank is bankrupt.
This downward spiral from maturity mismatch—borrowing short and lending long—to bankruptcy is quite profound, if only because the creditworthiness of the troubled bank’s assets—the 10-year US Treasury bonds in this case—was never in question. The bank entered bankruptcy not because the bank’s borrowers defaulted on the bank’s loans, but rather because a liquidity crisis forced the bank to incur capital loses, raising cash by selling perfectly creditworthy bonds for less than the bank paid for them. Thus, the approach the Federal Reserve took in the aftermath of SVB’s collapse: use the central bank’s lender of last resort function to lend to banks (as a last resort) against good collateral—think, the perfectly creditworthy 10-year US Treasury bonds, for example. Meanwhile, the FDIC chose to insure the uninsured deposits of ailing institutions—and, so in effect, all institutions, because how does the FDIC turn away another institution’s depositors now?
The central bank and the US Treasury, which in extremis backstops the FDIC, have ample tools available to stem a liquidity crisis of the sort that occurred in the last few weeks. The much more important question is what do regulators do to ensure such a crisis, spurred by banks’ disregard for a fundamental feature of intermediation, namely, maturity transformation, does not occur again? This is to say, by using these tools to stem a liquidity crisis, regulators introduced a time-inconsistency problem: believing regulators will let markets discipline derelict intermediaries going forward is hard, because how regulators behaved during this crisis suggests they will behave much the same next time. This moral hazard leaves little if any incentive for intermediaries to manage interest-rate risk more prudently going forward.
The liquidity crisis too shall pass; moral hazard is here to stay.
