
This blog post accompanies the SDPB Monday Macro segment that aired Monday, April 12. Click here to listen to the segment, which begins at minute 24:50 into the broadcast.)
On March 4th, the nonpartisan United States Congressional Budget Office—what economists affectionately refer to as the CBO—released its March 2021 long-term budget outlook for the federal government. Each year, the CBO releases its long-term budget outlook based on its 30-year projections of federal spending, revenues, deficits, and the debt. The projections assume all else is equal: specifically, that current budgetary laws regarding federal spending and taxing do not change in the next 30 years.
Of course, such laws will change: future fiscal stabilization policies may seek to soften the economic burdens imposed by business cycles, fiscal allocation policies may seek to improve economic productivity, and fiscal redistribution policies may seek to reassign rights to flows of income or shares of wealth between, say, individuals and households. Precisely because budgetary laws will change in the next 30 years, macroeconomists value the CBO’s baseline outlook as a well-informed and well-reasoned point of departure for analyses of the future budgetary positions of the federal government. Indeed, this point of departure is particularly useful now, as Congress and the President of the United States negotiate taxing and spending plans directed at allocation policies intended to improve the nation’s infrastructure, while simultaneously administering deficit-financed stabilization policies intended to address the short-term economic burdens imposed by the pandemic.
Because the future budgetary positions of the federal government are shaped, at least in part, by its current budgetary position—because debt accumulated now must be serviced later—a brief analysis of recent budgetary circumstances and the dynamics that have governed them helps to contextualize the CBO’s projections and their implications for fiscal budgetary conditions and U.S. macroeconomic performance going forward.
We begin in 2020; imagine that.
The effect of the pandemic on the U.S. economy has been exceptional. For example, viewed through the lens of gross domestic product (GDP)—the market value of all final goods and services produced within an economy over an interval of time—in the second quarter of 2020, economic activity contracted at an annualized rate of 32 percent! Put differently, on an annualized basis—this is to say, had the second-quarter economic disruptions persisted for an entire year—COVID-19 would have prevented a third of annual U.S. economic activity. This contraction is visible in Figure 1, in which I illustrate, in blue, real (inflation-adjusted) GDP and, in red, potential real GDP; the latter measures counterfactually the economic activity the U.S. economy would have attained were its available resources fully and optimally employed.
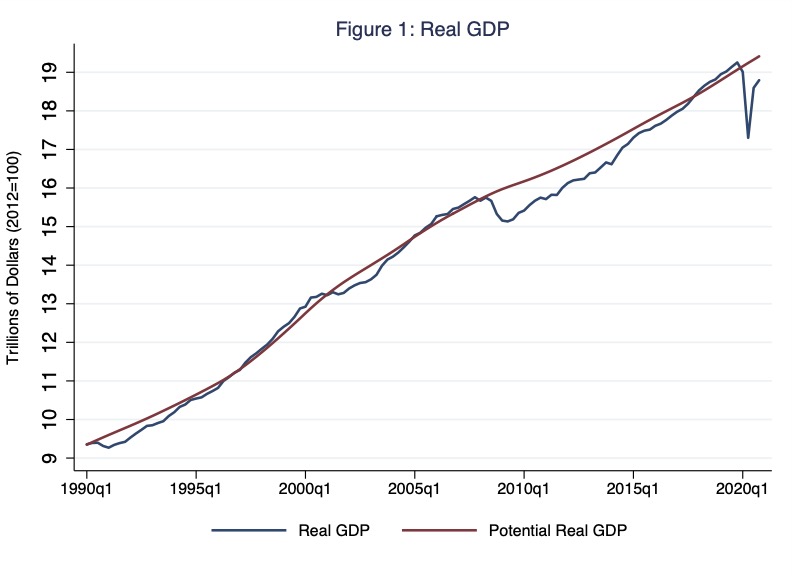
The so-called output gap, the difference between actual real GDP and potential real GDP, is visible in Figure 1 as the vertical distance between the red and blue lines associated with a given quarter. For example, in the second quarter of 2020, amid COVID-19 lockdowns, the output gap measured roughly -$1,940 billion. And, as of the fourth quarter of 2020, the output gap measured roughly -$620 billion. Alternatively, in Figure 2, I illustrate the output gap (in a more common and useful way) as a percentage of potential real GDP. Where the output gap in Figure 2 is zero percent, the economy is operating at full capacity; and where the output gap in Figure 2 is negative [positive], the economy is operating below [above] full capacity. In the context of this measure, then, in the second quarter of 2020, the U.S. economy operated at about 10 percent below its full capacity; note, in the trough of the Great Recession of 2008-09, the comparable figure is roughly half this amount. And, as of the fourth quarter of 2020, the output gap registered roughly -3.2 percent.
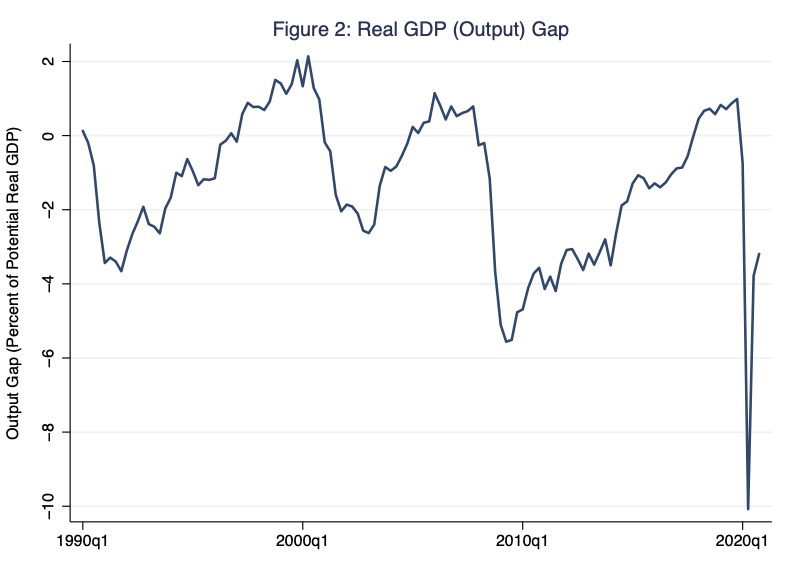
Since the second quarter of 2020, the economy has recovered rather dramatically; for example, compare in Figure 1 or 2 the time path of economic recovery after the Great Recession to the time path of economic recovery after the second quarter of 2020. From a strictly macroeconomic perspective, while the pandemic buffeted the economy with an enormous shock, the pandemic left the credit system largely intact, enabling a relatively strong recovery once the epidemiological threat has subsided. Nevertheless, the recovery has not completely closed the output gap; economic activity remains below its potential; the epidemiological threat is not gone; and, in any case, as Monday Macro devotees know well, real GDP is, at best, an average measure of economic well being. Many households have fared—and, in many cases, continue to fare—far worse than others. (For more on the limitations of GDP as a measure of economic well-being, see the Monday Macro segment, “Measurement Error.”)
So what’s a government to do?
It’s hard to say, exactly; for now, let’s consider the budgetary consequences of what the government did.
Since the second quarter of 2020, the federal government has unleashed a series of fiscal stabilization policies—think, for example, the $2.6 trillion CARES Act passed in March 2020 and the $1.9 trillion American Rescue Plan (ARP) passed in March 2021—intended, in effect, to repair households’ and firms’ budgetary positions and, in doing so, shrink and ultimately close the output gap. Fiscal stimulus of this sort (or any other) requires some combination of increased federal government expenditures, decreased taxes, and increased transfer payments (in the form of, say, the $1,400 stimulus checks that Congress appropriated via the ARP). Thus, fiscal stimulus changes the budgetary position of the federal government and, in turn, its debt position. And in the last twelve months or so, this change has been dramatic. In Figure 3, I illustrate, in blue, federal government expenditures and, in red, taxes net of transfer payments, each as a share of GDP and on a quarterly basis.

The vertical distance between the red and blue lines associated with a given quarter is a quarterly measure of the federal budget balance as a share of GDP; measured on a fiscal-year annual basis, this vertical distance would measure the familiar budget deficit [surplus] if expenditures (G) were greater [less] than taxes net of transfers (T – Tr). For example, in the now-infamous second quarter of 2020, this vertical distance measured, on a quarterly basis, a budget deficit of roughly 29 percent of GDP! As a practical matter, this enormous rise in the deficit was comprised to a very large extent of a rise in transfer payments—in this case, transfers to households from the federal government (as opposed to transfers to some households from other households)—and a fall in GDP. The effect on households of this enormous rise in net transfer payments is clearly visible in Figure 4, in which I illustrate the time paths of GDP and personal income relative to their respective values in 2010.
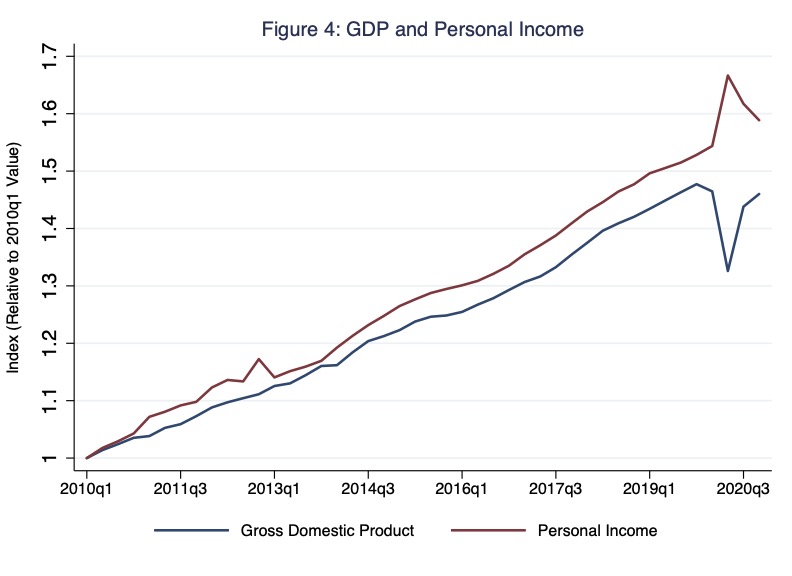
The way these two lines diverge in the second quarter of 2020 is unprecedented; and the interpretation is quite something: to wit, during the worst of the macroeconomic fallout from the pandemic, while GDP—think, economic activity in the aggregate—fell substantially and unemployment rose accordingly, personal income in the aggregate rose substantially, thanks, entirely, to the fiscal stimulus.
That’s gotta leave a mark.
At any moment in time, the accumulation of past federal fiscal deficits net of past federal fiscal surpluses—these have been exceptionally rare in the last three decades—comprises the federal debt. Thus, to the extent that deficit-funded fiscal stimulus leaves a budgetary mark, it does so on the federal debt. In Figure 5, I illustrate the federal debt as a percentage of GDP; the effects of fiscal stimulus in the aftermaths of the Great Recession and the outbreak of COVID-19 are clearly apparent in the shapes of steep, upward climbs of the debt.
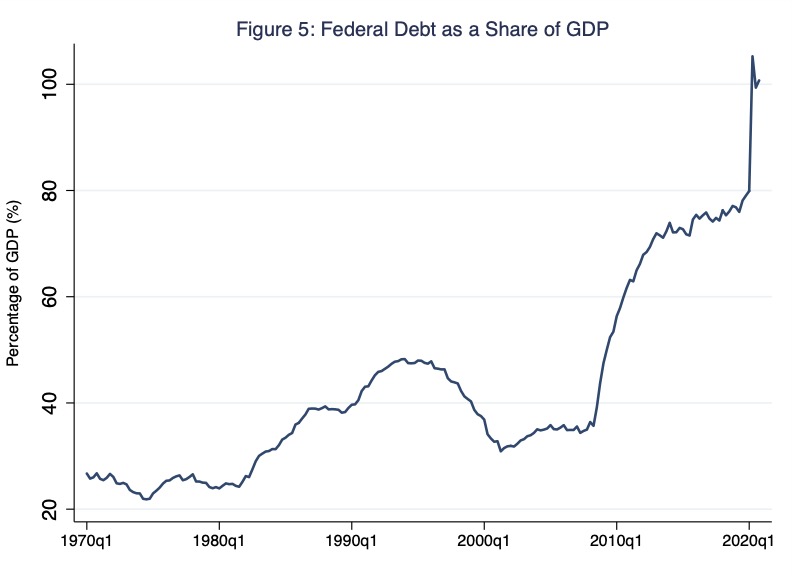
In the second quarter of 2020, the federal debt rose from 80 percent to 105 percent of GDP; in levels, this rise in a single quarter amounts to roughly $3.2 trillion, or very roughly the size of the economy of the United Kingdom in 2019 (valued at the current market exchange rate).
Relax, it could be worse.
The budgetary position of the federal government that I illustrate in Figure 3 is, formally speaking, the total fiscal balance, which we also refer to as the financial balance. The financial balance reflects, in part, interest expenditures paid on the pubic debt (because federal government expenditures include these interest expenditures). A measure of current budgetary actions is the primary balance, which we define as the financial balance excluding interest expenditures paid on the debt. In a given fiscal year, interest expenditures are predetermined by the level of debt and the interest rate at which the government borrows. Thus, as a corollary, as a share of GDP, given a balanced primary budget, the debt rises at the (interest) rate at which the government borrows and the debt falls at the rate at which GDP grows. (For more on the arithmetic forces governing debt dynamics, see the Monday Macro segment, “Fiscal Therapy.”) And throughout the last decade, the rate at which the government borrows (r) has remained below the rate at which GDP grows (g). In Figure 6, I illustrate this pattern based on the inflation-adjusted, long-run paths of r and g.
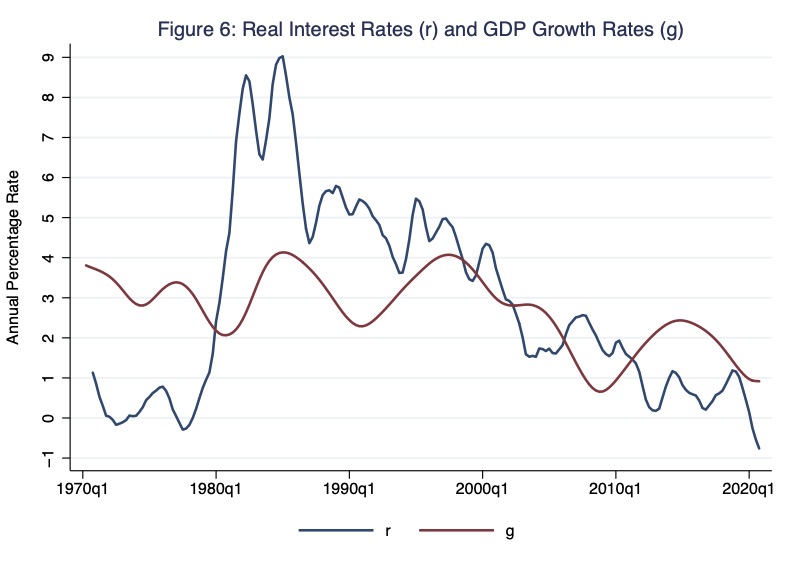
One implication of this simple analysis of debt dynamics is that, in principle, so long as r remains less than g, future (primary) budgetary actions could incur deficits without further increasing the debt as a share of GDP. This is to say, so long as the primary budget as a share of GDP is no more than the rate of g minus the rate of r times the debt as a share of GDP—currently by my measure no more than about 1.8 percent of GDP—debt as a share of GDP need not rise.
So all is well then? No.
According to the CBO’s March 2021 long-term budget outlook, in which the CBO incorporates neither the just-past $1.9 trillion ARP or currently proposed budgetary plans (including those directed at infrastructure, for example), between now and 2051 primary-budget deficits as a share of GDP are likely to exceed a debt-sustaining level based on any reasonable measures of the rates of g and r. The CBO identifies as the principal forces of future primary deficits spending for Social Security, Medicare, and other such government-sponsored health care programs, all due primarily to demographic forces driven by an aging population. The CBO does not forecast the high level of deficit spending during the pandemic to persist afterwards.
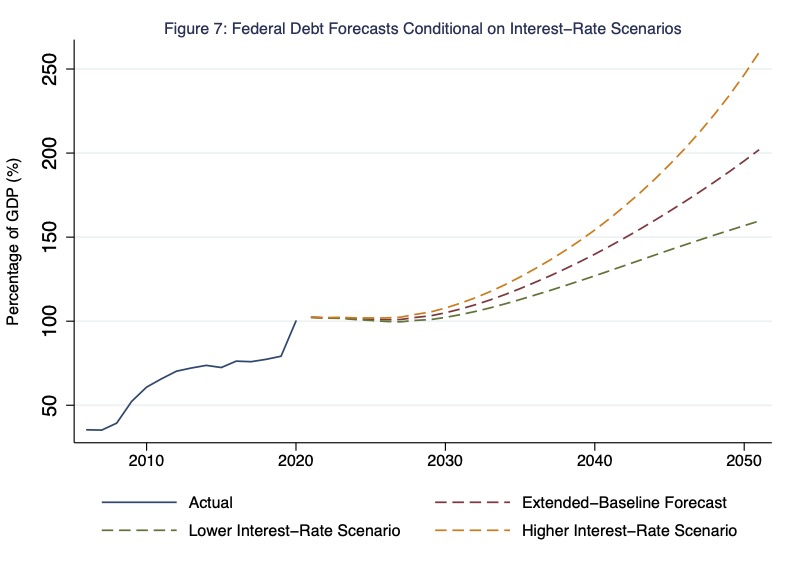
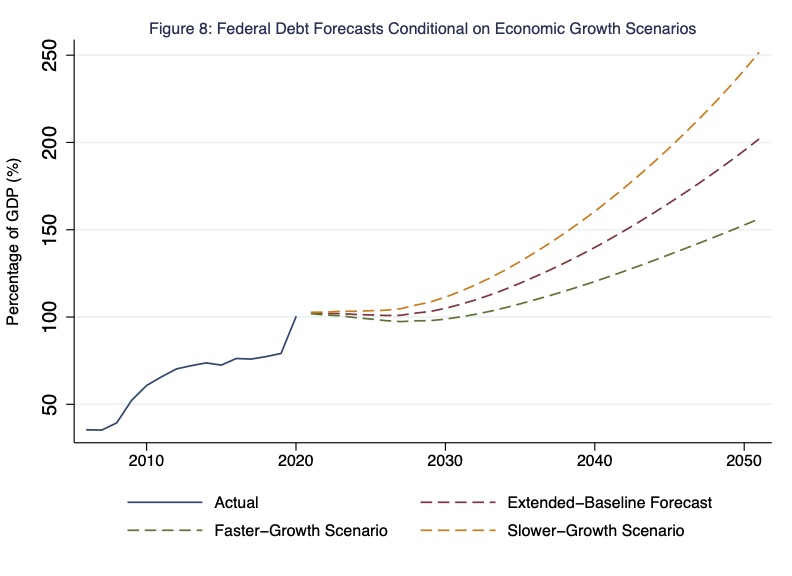
In Figures 7 and 8, I reproduce the CBO’s illustrations of the paths of the federal debt as a share of GDP conditional on various scenarios related to r (Figure 7) and g (Figure 8). Note, the actual debt illustrated by the solid blue line common to both Figures 7 and 8 is the annualized—and vertically compressed—version of the blue line illustrated in Figure 5. In the baseline case that the CBO illustrates in Figures 7 and 8, the federal debt rises to more than 200 percent of GDP by 2051. (The illustration of the baseline case is necessarily the same in both figures.) By comparison, in its 2019 long-term budget outlook, the CBO (baseline) projected that the federal debt would rise (by 2049) to 144 percent of GDP, a level it then described as “unprecedented” (CBO 2019, p. 2). Moreover, if r rises above the CBO’s baseline case (Figure 7; yellow line) or if g falls below the CBO’s baseline case (Figure 8; yellow line), the federal debt rises to more than 250 percent of GDP by 2051.
So, then, the sky is falling? Not necessarily.
There is no question the U.S. federal debt as a share of GDP is relatively high; and the CBO projects this debt to rise substantially. Among the unfavorable outcomes that the CBO deems more likely as a consequence of high and rising federal debt levels, three are particularly worth noting: a higher cost of borrowing to fund business investment (because public-sector borrowing effectively crowds out private-sector borrowing), a higher risk of a financial crisis (because investors lose confidence in the creditworthiness of the U.S. government), and a higher debt-servicing burden on the federal government (because the rise in the cost of borrowing due to a rise in interest rates is greater at relatively high debt levels).
Of course, as I indicated earlier, the CBO outlook assumes that current budgetary laws regarding federal spending and taxing do not change in the next 30 years. This need not be the case. Future budgetary laws could balance federal government expenditures and taxes net of transfers so that structural deficits do not drive the federal debt as a share of GDP ever higher. Moreover, according to the CBO, “Not all effects of higher debt and a higher projected path for debt would be unfavorable” (CBO 2021, p. 10). For example, the CBO notes that deficit-financed government-investment expenditures could enhance private-sector productivity, increase economic growth, and thereby somewhat lessen the burden of higher debt.
Government-investment expenditures that enhance private sector productivity—surely economists have a word for that.

One thought on “c-b-uh-oh”