
This blog post accompanies the SDPB Monday Macro segment that airs on Tuesday, October 5, 2021. Click here to listen to the segment, which begins at minute 23:00 into the broadcast.)
Inflation is having a moment. Seems everyone is talking about it and who is to blame for it. A few months ago, economists and casual observers alike seemed to direct much of the blame at the pandemic—its supply-chain disruptions and so forth. But the blame game has changed. Inflation hawks now have macroeconomic policy—specifically, monetary policy and, increasingly, fiscal policy—squarely in their sights. As you might imagine, macroeconomics has quite a bit to say about the possible sources of the inflationary pressures we currently experience, and the likelihood that fiscal policy is as much to blame as monetary policy—a growing sentiment, it seems. As usual, it’s complicated…in a good way.
Economics Nobel laureate Milton Friedman (1912 – 2006) famously proposed that inflation is always and everywhere a monetary phenomenon, a monetarist mantra to be sure. The implication economists take from this proposition is that inflation—think, a fall in the purchasing power of money—is uniquely and ultimately an outcome of monetary policy. Monetary policy is a macroeconomic stabilization policy conducted by a central bank when it targets the money supply, interest rates, and aggregate demand to achieve macroeconomic outcomes, including low and stable inflation and full employment. As monetarist thinking essentially goes, inflation occurs because too much money chases too few goods, monetary policy targets the quantity of money, and so inflation is purely a monetary phenomenon, full stop. By way of omission, the glaring corollary of Friedman’s proposition is, of course, that inflation is not a fiscal phenomenon. That is, fiscal policy—the other macroeconomic stabilization policy—does not sustain inflation. Presumably, the effects of changes in taxes, transfer payments, and government expenditures—the instruments of fiscal policy—are zero-sum: all else equal, fiscal policy does not ultimately stimulate aggregate demand and, thus, inflation; or, less formally, fiscal policy does not create jobs, at best it moves them around, as Friedman was quick to emphasize.
Friedman’s proposition seems quite provocative, particularly now, when government (fiscal) interventions in the economy—actual and proposed—are highly expansionary. In response to the pandemic, Congress appropriated and the federal government obligated—and, in most cases, reduced taxes, increased transfer payments, or increased expenditures by—roughly $4.7 trillion (USAspending.gov). Moreover, as of the date of this blog post, Congress debates appropriating about $5 trillion for infrastructure, defined narrowly (American Jobs Plan; about $1.5 trillion) and defined broadly (American Families Plan; about $3.5 trillion). Taken together, this amount of fiscal intervention—actual ($4.7 trillion) and proposed over the next several years ($5 trillion)—is on the order of roughly 50 percent of United States GDP in 2021.
Now, to be clear, not all fiscal interventions qualify as fiscal policy, a term economists reserve for government-funded macroeconomic stabilization policy, which, by definition, shapes the (short-run) features of the business cycle; those are the irregular fluctuations in aggregate economic activity including expansions, recessions, and, yes, depressions. Strictly speaking the roughly $4.7 trillion qualifies as fiscal policy, because the government implemented it in response to the recession caused by the pandemic; whereas the $5 trillion qualifies as either allocation policy (intended to increase productivity and, thus, the tax base over the long run) or redistribution policy (intended to redistribute existing income or wealth). In principle, allocation and redistribution policies could be self funded, immediately or relatively soon after these policies are implemented. By contrast, fiscal policy is typically not immediately self funded, and that is by design: policymakers intend expansionary fiscal policy to stimulate spending, not tax it away. Nevertheless, several trillions of dollars is a lot of spending to introduce into an economy that, by most measures, is less than $1 trillion away from full employment.
Surely all this fiscal spending, in one form or another, could stoke inflation, no?
It could, and not necessarily because Friedman’s proposition is invalid; though, according to one theory, it may be—more on that in just a bit. These days, inflation is certainly an observable phenomenon, monetary or otherwise. It seems everyone is concerned about inflation, and justifiably so. By any measure, the annual rate of inflation is above the rate (of about 2 percent) that macroeconomists generally prefer. In Figure 1, I illustrate the annual year-over-year rate of inflation according to the personal consumption expenditures (PCE) core price index; this is the measure of the aggregate price level the Federal Reserve prefers because, the central bank reasons, over time this measure best represents patterns in the purchasing power of money.
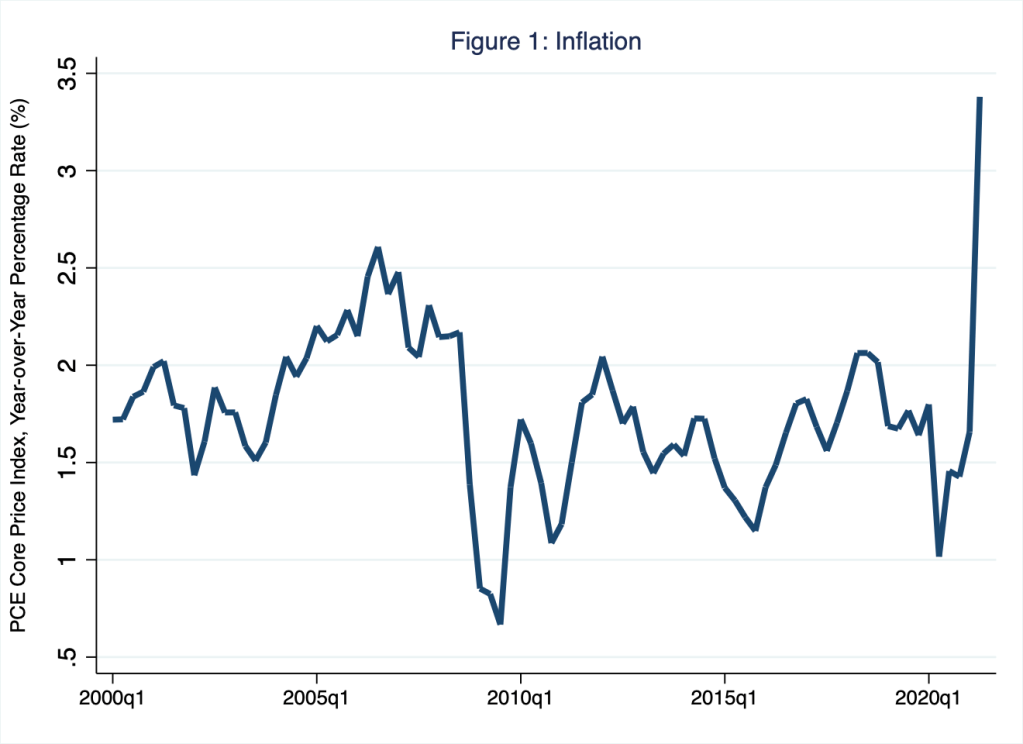
According to Figure 1, a 3.4 percent year-over-year rate of inflation in the second quarter of 2021 is relatively high; this rate was somewhat—though not entirely—unexpected. For the second quarter of 2021, economists expected a relatively high year-over-year increase in the average price level, however measured, if only because the average price level in the second quarter of 2020—and, specifically, April 2020—was extraordinarily low, thanks to depressed aggregate demand during the COVID-related lockdown. Nevertheless, most estimates of this so-called base effect—the difference between an extraordinary year-over-year inflation rate and the long-run (pre-pandemic) average inflation rate—fall in the neighborhood of roughly 0.4 to 1 percent. The additional rate of inflation of roughly 2.7 percent (3.4 percent minus a roughly .7 percent average base effect) was higher than most anyone expected. And since the second quarter of 2021, other measures of inflation, such as those based on the consumer an producer price indices (which are available on a monthly frequency) were much more elevated than PCE-derived rates.
Who is to blame?
To understand the sources of inflation, think about them in the context of a macroeconomic equilibrium, defined as the intersection of aggregate demand and aggregate supply, which I illustrate in Figure 2.
Figure 2: Macroeconomic Equilibrium
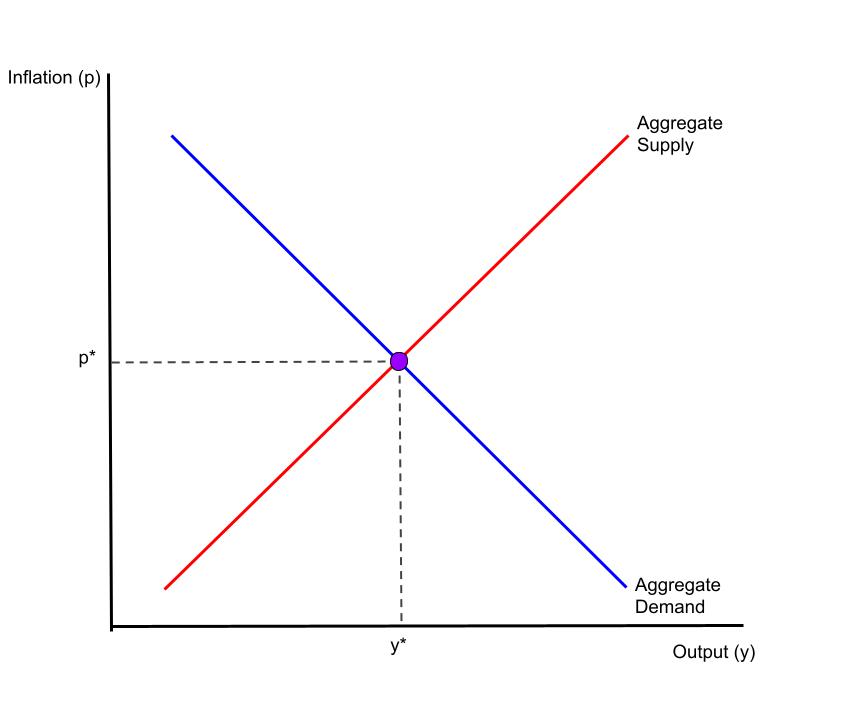
In Figure 2, the horizontal axis measures output—think, real GDP—and the vertical axis measures the rate of inflation. The aggregate demand curve reflects the total amount of expenditures demanded by all sectors of the economy: namely, households, firms, governments, and foreign buyers of our goods and services. The aggregate demand curve is downward sloping in this space because, given some growth rate in the quantity of money circulating in the economy, the total amount of expenditures demanded falls [rises] as the inflation rate rises [falls]. The aggregate supply curve reflects the total productive capacity of the economy. The aggregate supply curve is upward sloping in this space because, given the prices and quantities of the inputs to production, total output rises [falls] as the average price level of final goods and services rises [falls]. The intersection of the aggregate demand and aggregate supply curves simultaneously determines the equilibrium rate of inflation (p; vertical axis) and the equilibrium level of output (y; horizontal axis). According to this model, inflation rises if either the aggregate-demand curve shifts to the right (because consumer confidence rises, for example) or the aggregate-supply curve shifts to the left (because supply chains are disrupted by a pandemic, for example).
Monetary and fiscal policies pertain to the aggregate demand curve, if anything.
This is to say, the instruments of monetary and fiscal policies have no effect on the aggregate supply curve, which is why, incidentally, macroeconomic policy is powerless to alleviate directly the supply-chain disruptions unleashed by the pandemic; macroeconomic policy cannot speed up the unloading of cargo ships in the Port of San Diego, nor can it increase production of computer chips integral to the production of automobiles, for example. Thus, if anything, monetary and fiscal policies shift the aggregate demand curve. In Figure 3, I illustrate a rise in the rate of inflation caused by a rightward shift of the aggregate demand curve.
Figure 3: Macroeconomic Equilibrium and a Shift in the Aggregate Demand Curve
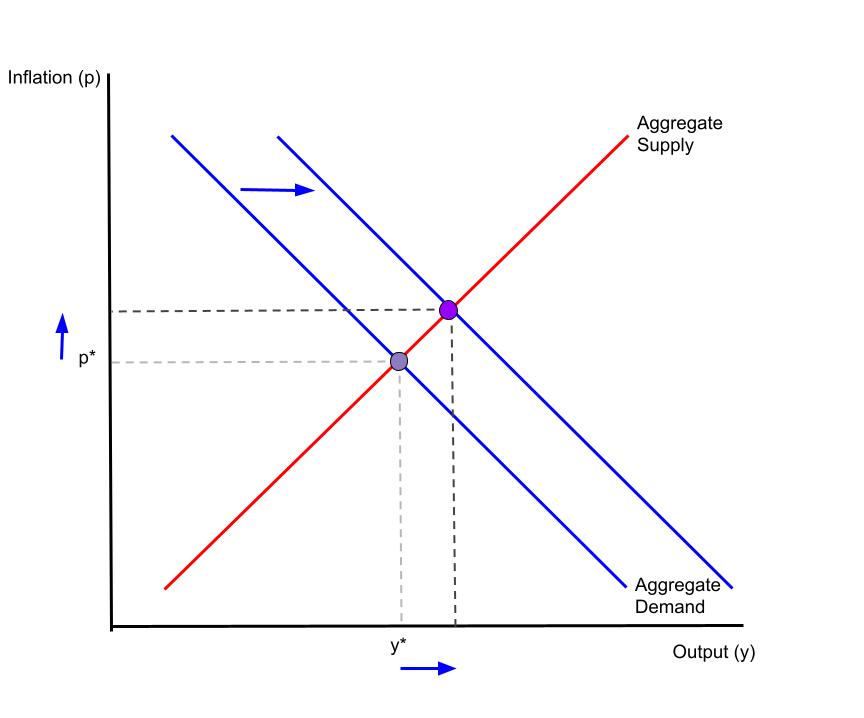
By definition, macroeconomic policy that shifts the aggregate demand curve to the right as Figure 3 illustrates is expansionary; in this case inflation and output rise. Correspondingly, macroeconomic policy that shifts the aggregate demand curve to the left is contractionary; in this case inflation and output fall.
Macroeconomists generally agree that monetary policy shifts the aggregate demand curve and, thus, drives inflation in theory and in practice. The intuition is straightforward (particularly for Schooled readers): if individuals hold amounts of money in roughly fixed proportion to their nominal income—so that the velocity of money is roughly constant over time—growth in the money supply drives growth in nominal GDP: inflation (along the vertical axis in Figure 3) rises and output (along the horizontal axis in Figure 3) rises, because the aggregate demand curve shifts to the right. In this case, inflation is clearly a monetary phenomenon. (For more on the relationship between money and inflation, see Monday Macro segment “Great (Inflation) Expectations.”)
Whether fiscal policy shifts the aggregate demand curve and, thus, drives inflation is a bit less straightforward, at least in theory. It seems the inflationary effects of fiscal policy work best in practice—yes, that’s a bit of macroeconomic humor—and even then, the inflation is likely a monetary phenomenon. To understand why, think about how households may respond to fiscal policy. Turns out, a theory that explains how fiscal policy affects the aggregate demand curve rests on a critical assumption of household behavior: whether households are Ricardian.
That’s Ricardian, as in the English classical economist, David Ricardo (1772 – 1823).
Ricardian Equivalence posits that rational households view expansionary fiscal policy—think, a tax cut—as equivalent to (the present value of) future contractionary fiscal policy—think, a tax hike. Thus, Ricardian households save tax cuts (because these households anticipate future tax hikes). In similar fashion, Ricardian households spend less if government spends more (because, again, these households anticipate future tax hikes). According to Ricardian Equivalence, deficit-financed tax cuts and government spending are zero sum: all else equal, fiscal policy does not affect the aggregate demand curve. Again, inflation is a monetary phenomenon.
Not so fast. Has anyone ever known a Ricardian household?
To be sure, Ricardian Equivalence rests on very strong assumptions. For example, not only must households be rational, they also must be immortal (or, at the very least, they must care about their offspring as much as they care about themselves), and they must be able to access credit as cheaply as the government can (otherwise a tax cut is a windfall low-interest loan with which households are right to fund consumption). Moreover, the productivity gains from government expenditures must be unexceptional (otherwise government spending may not require one-for-one future tax hikes). In practice, these assumptions are largely violated. Thus, in practice, deficit-financed tax cuts and government spending are not likely zero sum: all else equal, fiscal policy does affect the aggregate demand curve and, thus, fiscal policy drives inflation. Of course, all else equal includes monetary policy, which could neutralize expansionary fiscal policy—and a corresponding rightward shift of the aggregate demand curve—with contractionary monetary policy—and a corresponding leftwards shift of the aggregate demand curve. In this sense, even though fiscal policy instigates inflationary pressures, inflation is ultimately a monetary phenomenon.
To summarize, in the least likely case that households are Ricardian, fiscal policy does not affect the aggregate demand curve and fiscal policy does not drive inflation; inflation is a monetary phenomenon. And, in the most likely case that households are not Ricardian, fiscal policy does affect the aggregate demand curve and fiscal policy does drive inflation, but only if insufficiently tight monetary policy allows this to happen; inflation is a monetary phenomenon.
Indeed, the only way inflation could not be a monetary phenomenon in the traditional monetarist sense is if otherwise-Ricardian households are non-Ricardian because they reason the government is not bound by its lifetime budget constraints; concretely, the government will not raise taxes tomorrow to pay the nominal debt the government incurs today, for example. In this somewhat complicated and controversial fiscal theory of the price level, government deficits stimulate household spending, while the central bank sits by passively targeting interest rates (according to the macroeconomic features of the economy specified in a Taylor rule, for example). In this way, fiscal policy drives inflation, reducing the government’s nominal debt burden to the point where the government can satisfy its lifetime budget constraints. Thus, according to proponents of the fiscal theory of the price level—we call them fiscalists—inflation could be a uniquely fiscal phenomenon. As I said, it’s a controversial theory. See, for example, Woodford (2001).
Current inflationary pressure is a cost-pushed, fiscally stimulated, monetary phenomenon.
The supply-chain disruptions that the pandemic induced effectively reduced the economy’s ability to produce goods and services all else equal including monetary policy and the rate of inflation. In the context of our model of a macroeconomic equilibrium, supply-chain disruptions effectively shifted the aggregate supply curve to the left in the way I illustrate in Figure 4, where the outcome is higher inflation and lower output—think, the pandemic-instigated recession around the second quarter of 2020.
Figure 4: Macroeconomic Equilibrium and a Shift of the Aggregate Supply Curve
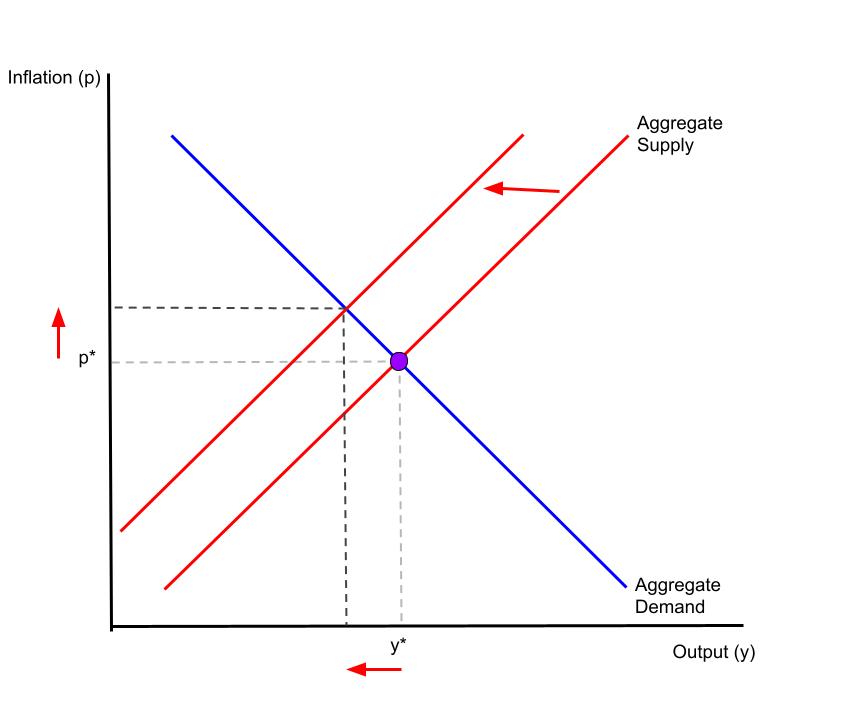
The so-called cost-push inflation that I illustrate in Figure 4 left macroeconomic policymakers with a very difficult choice: return inflation to its original level (p*)—this would require decreasing aggregate demand and further reducing output—or return output to its original level (y*)—this would require increasing aggregate demand and further increasing inflation. Monetary and fiscal policymakers chose the latter, leading to our current economic condition of relatively high inflation and near full employment, which I illustrate in Figure 5 in the context of our stylized macroeconomic model.
Figure 5: A Shift of the Aggregate Supply Curve and Policy Accommodation
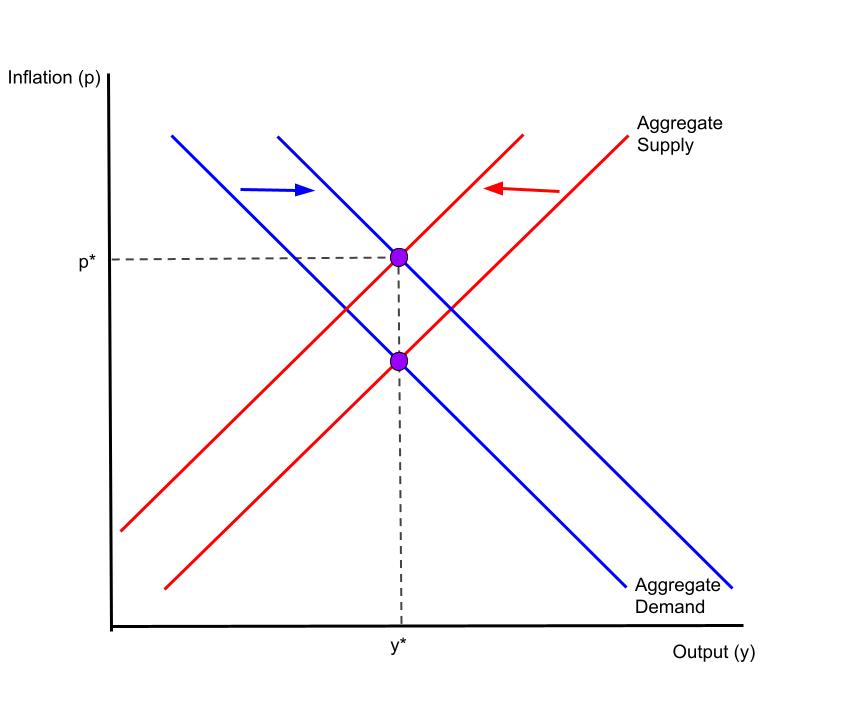
Throughout the pandemic, the Federal Reserve and the Congress have maintained historically expansionary monetary and fiscal policies, respectively. These actions have effectively shifted the aggregate demand curve to the right, raising inflation to levels we have not witnessed in decades; meanwhile, and importantly, these policies have stimulated output (and, correspondingly, employment). To be sure, neither the effect on inflation nor the effect on output would have been as large had policymakers not included fiscal policy in their policy mix. Thanks to the mix, a supply chain under enormous stress has responded more than it could otherwise to the (aggregate) demands of households flush with deficit-financed disposable income, stoking inflation—a monetary phenomenon the central bank has to this point accommodated.
The policy mix worked exceptionally well. It’s time to dial it back a bit.
References
Woodford, Michael. 2001. “Fiscal Requirements for Price Stability,” Journal of Money, Credit and Banking, 33 (3): 669-728.

2 thoughts on “always and everywhere”