
![]() This blog post accompanies the SDPR Morning Macro segment that airs on Monday, March 16.
This blog post accompanies the SDPR Morning Macro segment that airs on Monday, March 16.
On Sunday evening, March 15th, the Federal Open Market Committee (FOMC) of the Federal Reserve System convened an unscheduled meeting—the second in as many weeks—to take drastic action in the federal funds market: amid myriad uncertainties surrounding the novel coronavirus, and a growing consensus among macroeconomists, policy makers, and industry leaders that the economic consequences of the virus will contract macroeconomic activity and, possibly, spur a recession, the FOMC lowered its target range for the federal funds rate to between 0.25 and 0.0 percent; the range had stood, since the unscheduled FOMC meeting on March 3rd, at between 1.25 and 1.00 percent. To be sure, there is no question that the economic consequences of the virus will be negative and significant; and, thus, if monetary policy makers could reduce the economic burden, they should. Nevertheless, the question of whether the FOMC set the target range correctly in light of current (and anticipated) macroeconomic conditions remains open, as usual. This question, which is fundamental to conventional monetary policy making, is not new; rather, it is one macroeconomists ask often, in reference to all phases of the business cycle—epidemiologically instigated or otherwise.
To answer this question, we must know a counterfactual interest rate: the appropriate federal funds rate for a macroeconomy operating at full capacity with low and stable inflation—a macroeconomy performing at its best, if you will. If we were to know this interest rate, we could use it to judge the current stance of monetary policy; and, perhaps we could get some sense as to what more, if anything, a central bank could do during these unprecedentedly uncertain times.
But wherever might we find such a counterfactual interest rate—a neutral rate that corresponds to a monetary policy stance that is neither expansionary nor contractionary?
Look to the (r) stars…after a bit of setup.
The primary instrument of conventional monetary policy in the United States is the federal funds rate, an interbank rate that banks charge each other for bank reserves—inventories, essentially, that banks manage in order to generate earnings (by lending reserves to borrowers) and to maintain liquidity (by storing reserves for cash-seeking depositors). Thus, the nation’s central bank, the Federal Reserve System, targets the federal funds rate—the central bank does not directly control or otherwise administer the rate—in order to achieve the bank’s dual (Congressional) mandate of maximum employment (and, thus, output at or very near its potential) and stable prices (and, practically speaking, low and stable inflation). (For more on the Federal Reserve System, its Federal Open Market Committee (FOMC), and how the Fed’s trading desk manipulates the monetary base, at the direction of the FOMC, in order to keep the federal funds rate within the target range see the Morning Macro segment, “Fed Up.”)
As Morning Macro devotees may recall, the difference between actual output and potential output—the level of output the economy would achieve if it were operating at full capacity—is what economists call the output gap; and, the difference between the actual inflation rate and the target inflation rate (of 2 percent) is what economists call the inflation gap. Generally speaking, then, in the context of conventional monetary stabilization policy, the Fed lowers [raises] its target for the federal funds rate when either the output gap or the inflation gap is negative [positive]. This is because a negative [positive] output gap reflects an economy that is operating below [above] its potential. Similarly, a negative [positive] inflation gap reflects an economy in which the average price level is rising too slowly [quickly] relative to the Fed’s target inflation rate. (For more on output and inflation gaps, see the Morning Macro segment, “Mind the Gaps.”) In Figure 1, I illustrate the quarterly average federal funds rate since 1960.
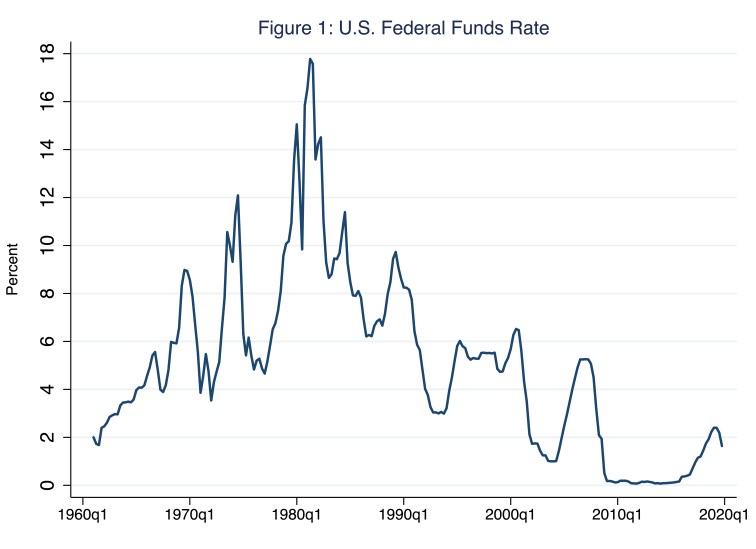
According to Figure 1, in the fourth quarter of 2019, the federal funds rate averaged 1.64 percent. To think about the target range for the federal funds rate in the context of output and inflation gaps, let’s examine the conventional monetary policy stance in the fourth quarter of 2019. In that quarter, the inflation gap (not pictured) was equal to an annualized rate of negative 0.40 percent: in that quarter, the average price level rose at an annualized rate of 1.60 percent instead of the targeted rate of 2.0 percent. The purchasing power of money fell too slowly relative to the Fed’s target inflation rate, recommending an expansionary target range for the federal funds rate. Meanwhile, the output gap (also not pictured) was positive and equal to 0.63 percent of potential output, recommending a (very mildly) contractionary target range for the federal funds rate. So which is it—expansionary or contractionary?
Okay, now look to the (r) stars.
What macroeconomists affectionately refer to as r-star is (counterfactually speaking) the “real [inflation-adjusted] short-term interest rate consistent with output equaling its natural rate and constant inflation” (Holston, Laubach, and Williams, 2016). Or, less formally speaking, r-star is the appropriate real short-term interest rate for a so-called Goldilocks macroeconomy—one that is neither too hot nor too cold but rather just right. For simplicity, macroeconomists often assume r-star is approximately equal to some average real interest rate that prevails over many years; so, for example, say, 2 percent. Nevertheless, there is very good reason to think that r-star does not equal 2 percent; there is also very good reason to think that r-star is not constant. Indeed, economic theory strongly implies that r-star changes with fundamental features of the world economy, including the growth rate of potential output and labor productivity as well as our time preferences and, thus, the supply of savings throughout the world (Holston, Laubach, and Williams, 2016). In Figure 2, I illustrate estimates of r-star based on the work of Holston, Laubach, and Williams (2016) (who freely acknowledge the relative imprecision of these estimates); incidentally, Williams is John C. Williams, current president of the Federal Reserve Bank of New York and, thus, ex-officio vice president of the FOMC—yep, that one.
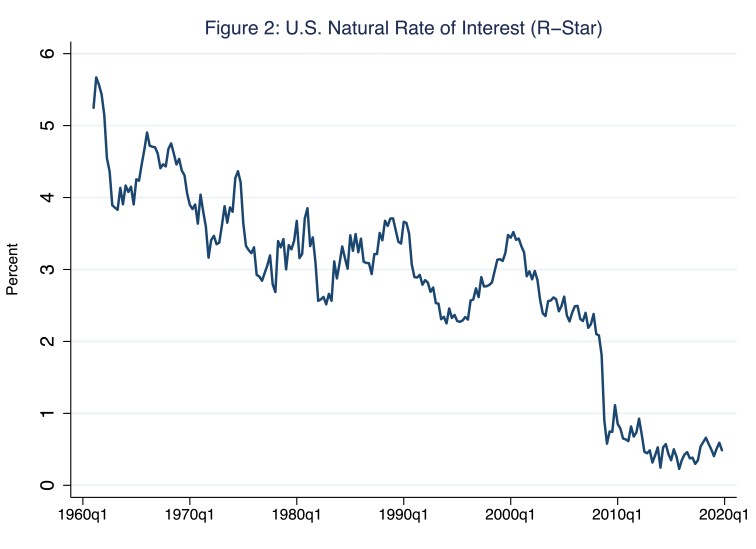
According to Figure 2, r-star has fallen throughout much of the late twentieth century; in the early 1960s, the rate hovered around 5 percent, whereas in the late 1990s, the rate hovered around 2.75 percent. Sometime around the Great Recession, r-star fell dramatically; currently it hovers around 0.49 percent. Of course, international monetary theory strongly implies that this pattern, which ultimately reflects the behavior of the returns to capital, should be evident in other economies that, along with the U.S. economy, share similar institutions and largely unfettered and highly integrated international capital markets. Thanks, again, to the work of Holston, Laubach, and Williams (2016), in Figure 3, I illustrate r-star for the United States (the same blue line I illustrate in Figure 2), along with r-star for Canada (red line), the United Kingdom (green line), and the Euro area (gold line).
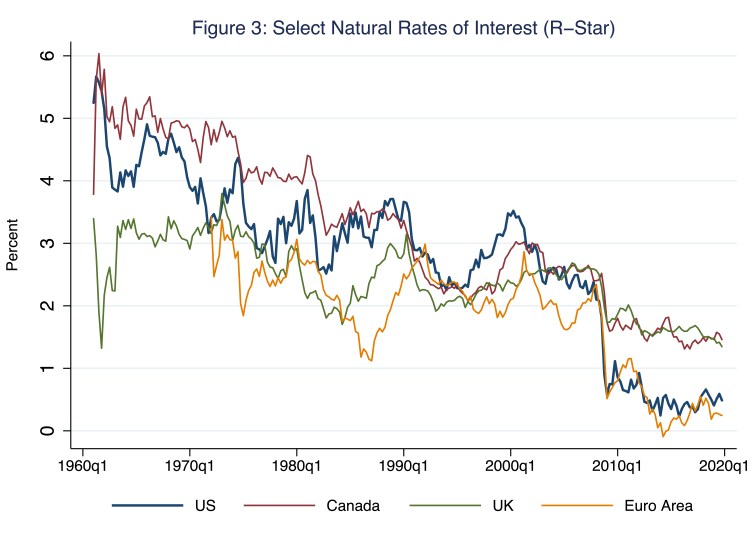
Sure enough, according to Figure 3, this pattern of a falling r-star is not unique to the United States; the similar paths of r-star in the U.S. and Euro area are perhaps most striking.
So, how does the U.S. r-star compare to the real federal funds rate?
Comparing r-star to the real federal funds rate offers a productive perspective on the stance of conventional U.S. monetary policy. Recall, r-star represents the neutral real, short-term rate that is consistent with output and inflation gaps that simultaneously equal zero. Or, less formally, r-star represents the real, short-term rate that is consistent with an economy operating at its best—an economy that is not in need of stabilization policy of any kind. In Figure 4, I illustrate U.S. r-star (blue line) and the actual (ex-post) real federal funds rate (red line).
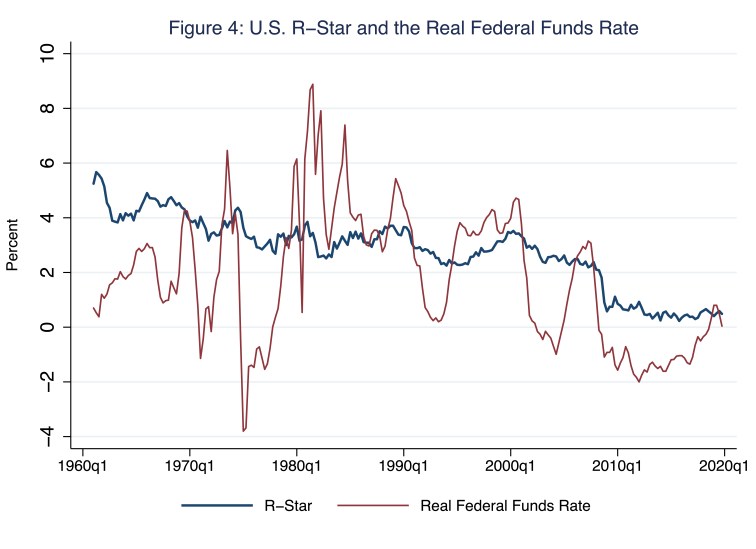
The real federal funds rate is generally below r-star when the output gap and the inflation gap justify, on balance, a target range for the federal funds rate that is expansionary (and, thus, below the neutral rate). Similarly, the real federal funds rate is generally above r-star when the output gap and the inflation gap justify, on balance, a target range for the federal funds rate that is contractionary (and, thus, above the neutral rate). So, for example, consider Figure 4 and the period since the Great Recession. During this period, the FOMC kept the target range for the federal funds rate below the neutral rate, r-star, because for much of this period actual output was below potential output (a negative output gap) while actual inflation was below 2 percent (a negative inflation gap). The two rates have since converged for the most part. In the fourth quarter of 2019, the quarterly average real federal funds rate registered 0.04 percent while r-star registered 0.49 percent: according to r-star, in the fourth quarter of 2019, conventional monetary stabilization policy was relatively (and, I reason, rightly) expansionary.
Finally, as Morning Macro devotees may recall, another way that macroeconomists use the output gap and the inflation gap to think about the stance of conventional monetary stabilization policy is through a so-called Taylor rule that essentially relates, via a seemingly simple (though rigorously substantiated) algorithm, the nominal (as opposed to the inflation-adjusted or real) federal funds rate to the gaps. As you might have surmised, it turns out the Taylor rule and r-star are very closely related. The most common version of the Taylor rule is specified as the following:
i = r* + π + 0.5×(inflation gap) + 0.5×(output gap)
In this expression, the term i is the target nominal federal funds rate; r* is, you guessed it, r-star (illustrated in Figure 2) and π is the rate of inflation. The output and inflation gaps are those I defined and described above. The weights on the gaps—in the specification above, the 0.5 multiplied times the inflation gap and the 0.5 multiplied times the output gap—reflect the central bank’s preferences, informed by the Fed’s dual mandate, for output and inflation stability. In Figure 5, I illustrate a federal-funds rate target informed by the Taylor rule.
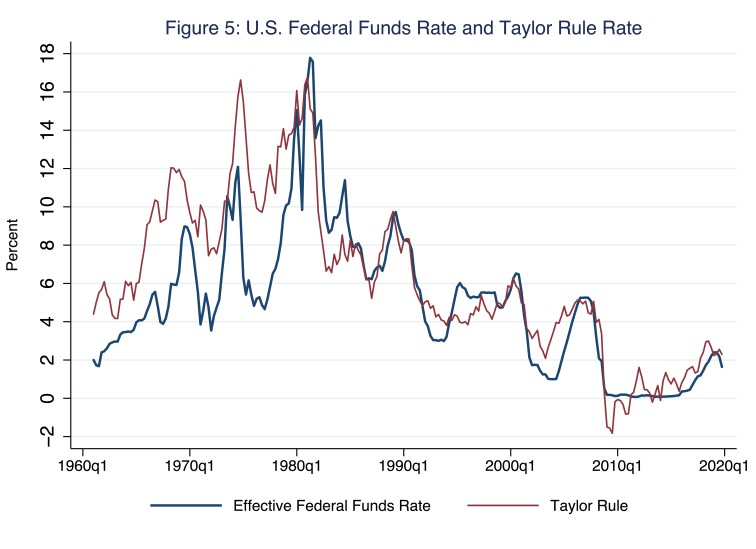
In Figure 5, the blue line is the actual (or effective) federal funds rate, which I reproduce from Figure 1; the red line is the federal funds rate target that the Taylor rule recommends. Thus, the Taylor rule incorporates r-star in order to inform conventional monetary stabilization policy. In the context of Figure 5, the federal funds rate (blue line) essentially describes what the FOMC did, whereas the Taylor rule (red line) describes what the FOMC should have done according to the rule and based on the levels of r-star, the output gap, and the inflation gap. As a first pass, the rule fits the actual rate well enough. For example, throughout much of the decade since the Great Recession, the actual federal funds rate has essentially followed the basic Taylor rule. Indeed, if anything, during this period, the FOMC has kept the actual federal funds rate (blue line) below the Taylor rule rate. For example, in the fourth quarter of 2019, the quarterly average federal funds rate registered 1.64 percent while the Taylor rule registered 2.30 percent. This is basically the same message we gleaned from Figure 4: according to the Taylor rule, in the fourth quarter of 2019, conventional monetary stabilization policy was relatively (and, I reason, rightly) expansionary.
In any case, since the fourth quarter of 2019, the Federal Reserve’s monetary policy stance has changed rather dramatically. On March 3rd, in an effort to stabilize the U.S. economy because it will likely be buffeted by economic shocks associated with the novel coronavirus, the FOMC lowered its daily target range for the federal funds rate by a half of one percentage point to a range of 1.0 to 1.25 percent. Then, on Sunday evening, March 15th, the FOMC lowered its daily target range for the federal funds rate by an additional 1 percentage point, to a range of 0.0 to 0.25 percent.
Although we know that the target range for the federal funds rate has just fallen dramatically, we cannot know precisely the current value of r-star, which we cannot observe directly or estimate precisely in realtime. So, we cannot know for certain if the conventional monetary policy implemented this weekend is sufficiently accommodative, which we would like it to be given the current consensus outlook for the macroeconomy. Nevertheless, assume for argument sake that the new range for the federal funds rate is accommodative. Even then, the prospects for conventional monetary policy are not terribly promising: expansionary conventional monetary policy seemed anemic long before the novel coronavirus emerged, introducing economic challenges to which even relatively effective macroeconomic policy is ill suited; and now that the target range for the federal funds rate is at its lowest (because the FOMC is not inclined to induce a negative federal funds rate), there is no room for further conventional monetary policy easing.
If only there were another tool in the shed.
References
Holston, Kathryn, Thomas Laubach, John C. Williams. 2016. “Measuring the Natural Rate of Interest: International Trends and Determinants.” Federal Reserve Bank of San Francisco Working Paper 2016-11.

2 thoughts on “r-star is born”